
2
Report to/Rapport au:
OTTAWA PUBLIC LIBRARY BOARD
CONSEIL D’ADMINISTRATION DE LA BIBLIOTHÈQUE PUBLIQUE D’OTTAWA
November 17, 2014
17 novembre 2014
Submitted by/Soumis par : Matthew Pritz
Manager, Finance and Business Services / Chef de Service, Services des affaires et entreprises
Contact Person / Personne ressource: Matthew Pritz
(613) 580-2424 x12727, Matthew.Pritz@BiblioOttawaLibrary.ca
|
Ref N°: OPLB-2014-0102 |
SUBJECT: Semi-Annual Performance Measurement Report–January to June 2014
OBJET : Rapport sur le cadre de mesure du rendement semestrielle – janvier à juin 2014
|
REPORT RECOMMENDATION That the Ottawa Public Library Board receive this report for information. RECOMMANDATION DU RAPPORT Que le C.A. de la Bibliothèque publique d’Ottawa prenne connaissance de ce rapport à titre d’information. |
BACKGROUND
The Ottawa Public Library (OPL) Performance Measurement Framework (PMF) was approved by the Board at its meeting of May 13, 2013. The framework utilizes a balanced scorecard approach with ten key performance indicators in four categories.
The PMF is outcome (or results) based, focusing on strategic thought processes and analytical thinking to inform decision making and build an organizational culture of continuous improvement.
Full implementation of this framework is a gradual process that will develop with the data accumulated from recurring measurement cycles. Program Fill Rate and Average Materials Supply Time will require additional measurement periods to establish trends, benchmarks, and targets. Future benchmarks and targets will be established in consultation with management teams, and by analysing trends over a three-year period.
This report reflects results from the second measurement period (i.e. Jan-June, 2014). Wherever possible, data is presented in a graphical manner. Data is collected through a variety of sources, including: OPL’s integrated library system; the City’s human resources/financial management system (SAP); and manual data gathering. While the PMF provides a consistent, replicable method of measurement, it is flexible and may be adjusted over time. Further, it focuses primarily on ratios in order to take a more strategic view of performance when measuring the overall health of the organization.
Events influencing overall performance during the period from January to June, 2014 at OPL include a strong increase in downloadable media such as e-Books, increased wireless internet and database usage, and a decrease in overall circulation as a result of numerous branch improvement projects. These projects include:
· Phase one of a two-phase RFID retrofit for the Greenboro and Cumberland branches;
· Improvements at the Main Branch resulting from the approval of the risk mitigation strategy last fall. From late April to early June the Children’s area at the Main branch underwent improvements which limited access to programming and library materials.
· The closure of the Beaverbrook branch for the entire measurement period, one of our top 3 circulating branches. The branch was expanded 2.5 times its size and was significantly retrofitted to become an example of a modern library facility, fit for 21st century service delivery.
1. Customer Satisfaction (CS)
Customer Satisfaction is gauged by three measures: Three-year Active Card Holder Penetration, Total Circulation, and Electronic Visits.
CS 1. Cardholder Penetration
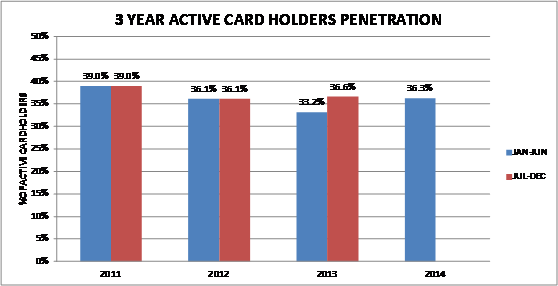
[Cardholder penetration represents the number of active card holders in the last three years, divided by the city’s population.]
An active card holder is defined as a customer, who during the last 3-years, updated their card; borrowed, renewed or returned library material; was issued and/or paid a fee or fine; reserved library material, a computer, registered for a library program, or logged onto their account via the library’s virtual branch and/or catalogue. Population figures are provided by the City’s Planning & Growth Management Department.
Between January and June 2014, OPL achieved a rate of 36.3%, an increase of 3.10% over the same period in 2013. This increase is attributed to focused adult programming (e.g. new author series), and an increase in the number of Chromebooks available to customers for borrowing. Nepean Centrepointe experienced an increase of 43.91% in new memberships from the opening of the Makerspace in May through the close of the measurement period at the end of June.
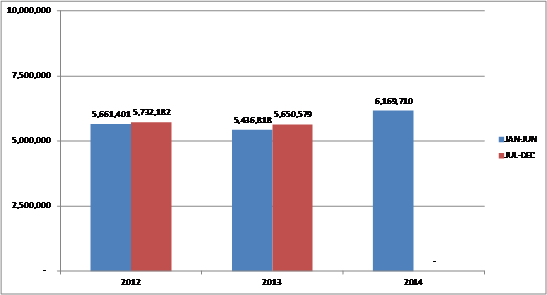
CS 2. Total Circulation
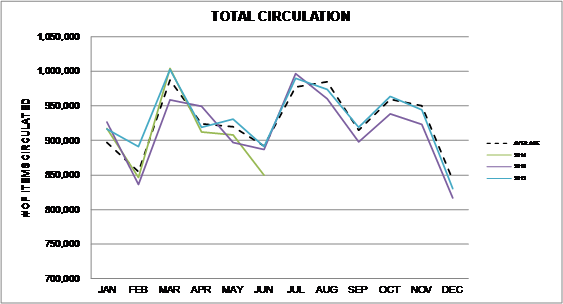
[Total circulation encompasses first-time circulation, renewals, and digital downloads.]
Total circulation is a reflection of the ease with which customers can borrow materials, as well as the relevance of our collections in meeting our customers’ wants and needs. The historical three-year trend continues to show that circulation patterns are seasonal with the greatest activity occurring in three phases: 1) late in the first quarter, 2) during the summer months, and 3) well into the autumn season following the beginning of the school year.
The first quarter of 2014 is on target with the three year average. The decline in the second quarter of 2014 was impacted by extensive improvements and re-organization to the children’s area and public PC areas at the Main branch as well as closures related to Radio Frequency Identification (RFID) retrofits at the Greenboro and Cumberland locations. An increase in overall circulation for subsequent measurement periods are anticipated with the reopening of the expanded Beaverbrook branch at the beginning of August 2014.
CS.3 Electronic Visits
[Electronic visits are counted when a customer accesses the library’s website, catalogue, and databases through network or wireless means.]
Electronic visits have increased approximately 13.48 percent from the same period in 2013. Usage of e-resources continue to grow as customers shift their information seeking and reading patterns to include electronic formats. As more eContent is also made available to customers, such as streamed music and French-language eBooks, eBook circulation from the virtual branch threatens to eclipse the physical circulation at the library’s busiest branch, Main Library, in 2014 for the first time. Definitions were evaluated in 2014 to ensure that usage of all electronic platforms were included in the usage count.
2. Employee Development and Engagement (EDE)
The OPL collects data for two key performance indicators that address employee development and engagement: Training Hours per Employee, and Employee Turnover Rate.
EDE.1 Training Hours per Full-time Equivalent
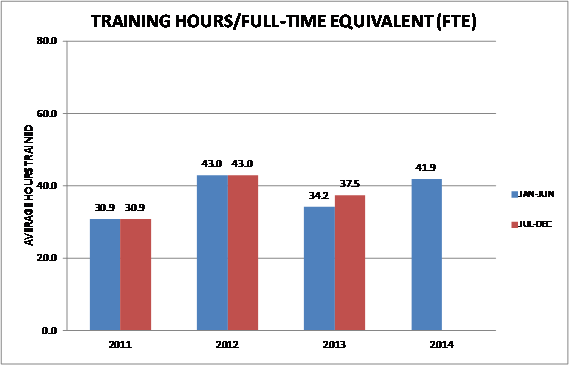
[Training hours per employee represents the number of training hours offered during the measurement period divided by the number of full-time equivalents.]
A full-time equivalent (FTE) is a figure that consolidates the number of full-time, part-time, and casual employees in a more understandable manner. At the OPL, one FTE represents 1820 hours worked per year. Typically, the number of FTEs is less than the head count (actual number of employees). Full-time equivalents are used instead of a head count in order to provide consistency across measurement periods. Training includes participation in online and in-class training programs offered by the OPL or the City of Ottawa.
Results in January to June 2014 increased by 22.51% from the same period in 2013. The increase is the result of enhanced training programs designed to align staff with new service models focused on excellence, and to prepare staff with technology training required for the continued roll-out of RFID.
EDE.2 Employee Turnover Rate

[Employee turnover rates indicate the number of employees who left the organization over the course of the measurement period.]
From January to June 2014 the employee turnover rate was 7.9%, an increase of 2.81% over the same period in 2013. With an aging workforce as its largest demographic, and a large number of transient employees composed of university and high school students, this was an anticipated outcome. It is normal for the OPL to have a 6% turnover rate, plus or minus 2%.
3. Finance (F)
The organization’s financial health is measured by the following two metrics: Operating Cost per Capita, and Operating Cost per Library Use. In these measures, cost is defined as all costs associated with the day-to-day operation of the OPL.
F.1 Operating Cost per Library Use

[Cost per library use measures the ratio between operating costs divided by the total number of library uses during the measurement period.]
Library use is comprised of circulation, electronic downloads, program attendance, and electronic visits. This indicator provides a financial picture in terms of people using the library. For this measurement period, cost per use has increased 1.59% when compared to January to June of 2013. While library usage increased (particularly in terms of website visits) these were not sufficient to offset the impact of operating costs resulting from training activities related to RFID implementation. In 2014 the branches converting to RFID are among our largest and busiest with the greatest number of employees, most of whom are being trained on this new technology.
F.2 Operating Cost per Capita
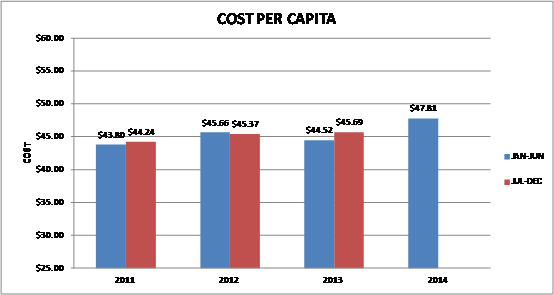
[Operating cost per capita measures the ratio of total operating costs for the measurement period divided by the City’s population.]
This measure shows the extent to which the operating budget is growing over time to meet the demands of an increased population and demonstrates the extent to which operating expenditures are balanced over the year. The measure is also an indication of cost controls within OPL operations and portrays the relationship between population growth and budget and operational activity patterns.
The result for the January to June 2014 period was $47.81. This represents a 7.3% increase from the same period in 2013, and a 4.71% increase compared to 2012. Increases in costs per capita are the result of increased operating expenditures associated with the introduction of new services (eg. the Makerspace, at the Nepean Centrepointe location), increased employee activities in preparation for the re-opening of the Beaverbrook branch, and enhanced service training programs designed to align staff with new service models.
4. Operational Effectiveness (OE)
Operational Effectiveness is assessed using three measures: Materials Turnover Rate, Materials Average Supply Time, and Program Fill Rate.
OE.1 Materials Turnover Rate

[Material turnover is calculated by dividing circulation figures for the measurement period by the number of items in the collection.]
A high turnover rate is indicative of a collection that is used frequently, with higher values generally signifying effective selection of materials that are relevant to customers.
Between January and June 2014 materials turnover decreased by 5.34%, as compared to the same period in 2013. The library materials purchased but reserved from circulation in preparation for the reopening of the Beaverbrook location contributed to this result, along with the extensive improvements and re-organization to the children’s area and public PC areas at the Main branch, as well as closures related to RFID retrofits at the Greenboro and Cumberland locations.
OE.2 Average Material Supply Time
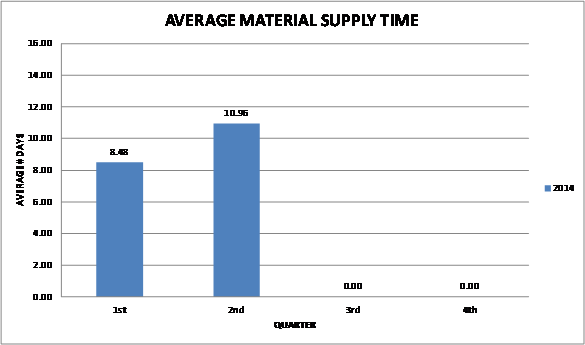
[Average materials supply time measures the average time it takes from “time of order” to “available for circulation” of a physical circulating item.]
The measure is new and as such comparative data from previous periods is not available. The average physical material supply time for the first full measurement period for this indicator (January to June 2014) is 9.72 days. Results from January-June 2014 corroborate results obtained from an ad-hoc small-scale analysis done in 2012. Benchmarks will be developed upon tracking future measurement periods.
OE.3 Program Fill Rate
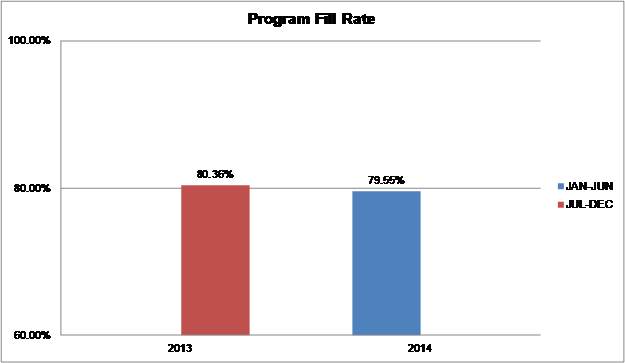
[Program fill rate is a new measure that represents the number of people who attended a library program divided by the number of total spaces available.]
This measure does not include outreach initiatives or large-scale marquee events where pre-registration is not required. For the period of January 1, 2014 – June 30, 2014, OPL achieved a 79.55% fill rate. This decrease from the same period in 2013 reflects the challenges associated with the launch of a new on-line registration platform which experienced technical configuration issues in January of this year, which have since been resolved.
CONSULTATION
There were no public or external consultations in preparation of this report.
LEGAL IMPLICATIONS
There are no legal implications associated with this report.
RISK MANAGEMENT IMPLICATIONS
There are no risk implications associated with this report.
ACCESSIBILITY IMPACTS
There are no accessibility impacts associated with this report.
TECHNOLOGY IMPACTS
There are no technology impacts as a result of this report.
FINANCIAL IMPLICATIONS
There are no financial cost implications associated with this report.
BOARD PRIORITIES
This report is in response to Report #5, Board Governance Review, November 19, 2012, which states “Develop, with Board input as appropriate, improved indicators of organizational performance, including objectives and metrics that focus on output, outcomes and results, and incorporate these into a monitoring process, for Board review and approval as well as the Boards subsequent approval of the Ottawa Public Library PMF in May, 2013.”
SUPPORTING DOCUMENTATION
· Report#3, Semi-Annual Performance Measurement Report–July to December 2013
DISPOSITION
Measurement activities commenced as of January 1, 2014 with a requirement to collect all necessary information as required by the PMF. The next measurement period, (Period 2, 2014) will close on December 31, 2014 with the next PMF report to be brought to the Board in April, 2014.