Document 2
Document 2
Table of Contents
1.
Executive Summary
2.
Context
2.1 Current Environment
2.2 Broader Municipal Expectations
2.3 Future Environment
3.
Objectives and Priorities
4.
Inventory of Assets
4.1 Conventional Transit Rolling Stock
4.2 Specialized Transit – Rolling Stock
4.3 Light Rail Transit – Rolling Stock
4.4 Facilities – Stations/Terminals, Shelters, Garages, Administration Buildings
4.5 Information Technology Systems
5.
Maintenance Program
5.1 Conventional Transit – Rolling Stock
5.2 Specialized Transit – Rolling Stock
5.3 Light Rail Transit – Rolling Stock
5.4 Auxiliary Fleet Transit
5.5 Facilities
5.6 Transitway, roadway etc
5.7 Administration
5.8 Continuous Improvement
6.
Capital Program
6.1 Conventional Transit – Rolling Stock
6.2 Facilities – Stations/Terminals, Shelters, Garages, Administration Buildings
6.3 Information Technology Systems
6.4 Transitway and Road Network
7.
Financial Program
8.
Risk Management Analysis
9.
Performance Measures
Appendix A
Capital Projects
Appendix B Detailed Inventory of Conventional Rolling Stock and Light Rail
In May 2004, the provincial government announced that two cents per litre of the existing provincial gas tax would be transferred to municipalities to assist in expanding and renewing their public transit system with the objective of increasing transit ridership. The provincial gas tax funding was phased in, starting with one cent per litre in October 2004, was increased to 1.5 cents per litre in October 2005, and will rise to two cents per litre in October 2006.
The Gas Tax Agreement between the City and the Province of Ontario requires the City to develop and adopt a Transit Ridership Growth Plan (TRGP) and a Transit Asset Management Plan (TAMP). The Province issued guides for the development of these two linked documents. This document is the Transit Asset Management Plan. The Transit Ridership Growth Plan is being submitted to the Province separately.
The TAMP encapsulates the strategies and initiatives that will attempt to deliver the transit system capacity required to attain the ridership and modal split targets of the Official Plan, Transportation Master Plan and the Transit Ridership Growth Plan.
The development of a TAMP serves two purposes. Firstly, it will be the submission to the Province to demonstrate the extent to which the municipality has the system components, maintenance and funding plan developed, with an eye to growth and enhancement, to support the achievement of the ridership and modal split targets. Secondly, the TAMP will provide an internal document that will be updated to reflect changes in strategy and assets for internal planning and operational purposes.
As a best practice the TAMP forces an organization to take stock of what it has, identify deficiencies or gaps in asset condition or capacity and it presents the financial requirement for maintenance, refurbishment, enhancement and system growth. It also outlines the evolution of these assets over time based on assumptions of technological improvements as well as how the performance of these assets will be monitored.
After gathering a comprehensive inventory of the inputs required to provide transit service in the City, the policies that govern its provision, and the objectives that are envisioned for transit service in the future, the following key priorities have been developed for transit assets:
1)
Maintaining Current Asset Capabilities
The most visible assets of the transit system are its rolling stock and the stations used for boarding and alighting. The expected life of a transit bus is 18 years based on 12 years from the Original Equipment Manufacturer (OEM) and six years after refurbishment, as required by the Ministry of Transportation under the Ontario Transit Vehicle Program (OTVP). Under the OTVP, the City receives 33 per cent of the capital cost of a replacement bus and 33 per cent of the cost of the 1st refurbishment
The Capital Program contains $66M for Bus Refurbishment over the life of the TAMP which is projected to refurbish 493 buses. There are 176 buses in the current fleet which will be retired at the end of their useful life and replaced with new revenue buses, with an estimated capital requirement of $135M.
From a facilities standpoint, RPAM will implement the three phases of the Comprehensive Asset Management Strategy in 2006 as part of its Departmental Business Plan which will take into account transit facilities and the maintenance facilities. Life Cycle Renewal and other transit facility work will require $41M in funding. The expansion of the fleet will require the construction of two new transit maintenance garages for $140M during the TAMP timeframe. Bus maintenance equipment renewal within the maintenance facilities will be $17M.
The Transitway provides a vital link to the downtown core and across the City from East to West or North to South. Significant rehabilitation will take place with $7M in work planned.
There is also a requirement to continue to maintain the road network and further use of transit priority measures ($8M) to ensure that this asset contributes to the success of the dedicated corridors.
2)
Improving Efficiency, Effectiveness and Customer Service
A number of projects in the Capital Plan aim to improve operations and passenger amenities through refinements of the rolling stock, stations, and technology interfaces. Transit Computer Systems New Initiatives and the Integrated Transit Control Centre will require $24M in planned funding. Onboard the buses, the Smart Bus Information System will improve operational on-time performance, customer information, optimize bus resource allocation and reduce overall costs through enhanced fleet monitoring capabilities. It will facilitate enhanced customer amenities that will be possible because of the installation of this backbone across the fleet and the transit network. These include next vehicle arrival displays at major transit stops. The initial steps in the implementation of the “Smart Card” electronic fare system, which will be built upon the Smart Bus communication framework, are being taken this year2006 with the objective of having the system in place by 2008. This project will require $11.6M in funding for realization.
Technology will also enhance the efficiency and the effectiveness of Para Transpo operations through the implementation of Interactive Voice Response (IVR) system to allow customers to cancel bookings at any time, allowing vehicles to be reassigned to other tasks and improve overall service – approximately $125,000 in funding for 2006.
Customer safety while traveling will be part of the Integrated Security Management System (ISMS) program designed to address concerns and risks to the security of persons and assets within City of Ottawa facilities. The program involves installing a wide range of security devices, including closed circuit television (CCTV), Intrusion Alarms, Access Control, Alarm Response, etc., which are integrated into one comprehensive ISMS and monitored 24-hours a day by the City’s Security Operations Centre. The Capital Program of Transit Facilities identifies $146,000 in required funding. Some of this may be offset by Federal contributions as this is a Federal priority as well.
3) Expanding Capacity to Achieve Ridership Growth
The most important project aimed at expanding system capacity is the development of the North-South light rail transit line, which will be realized in the TAMP timeframe, and continued work on the addition of the East West light rail line. These initiatives will require $1.42B in funding.
The procurement and implementation of the North-South light rail system is being managed by the Planning and Growth Management Department and is identified in its Departmental Business Plan as a key supporting objective of the Transit Ridership Growth Plan. The system is being developed through a public private partnership with the private sector contractor designing, building and maintaining the system for a fifteen-year period. The maintenance responsibilities of the contractor will include all life-cycle maintenance of the system, including structures, stations and the maintenance facility. Transit Services will operate the system as part of the City’s integrated public transit network and custodial maintenance will be provided at stations by RPAM.
The Transitway and its expansion will continue to be an important component of the service into the future with $43M for light rail integration preparations and expansion plus $363M for specific projects such as the West Transitway (Bayshore to Pinecrest), the Southwest Transitway (Fallowfield to Nepean Town Centre), Cumberland Transitway as an interim measure proceeding light rail, West Transitway (Terry Fox-Eagleson), EA studies and protection of future corridors. Park and Ride facilities will also be expanded with $20M in capital work planned.
During the timeframe of the TAMP there will be an additional investment of $199M in bus fleet expansion that will enhance the capacity of the fleet. The fuel type and configuration as well as new passenger amenities will be evaluated at the time of the procurement order.
In total, Transit Service provision allocated to meet the goals of the Transit Ridership Growth Plan will require $2.48B in capital funding. There are several differences in the expenditure numbers used in TRGP and in TAMP. The $4.4B in capital costs in the TRGP is based on the Transportation Master Plan which covers the period 2003 to 2021. The $2.48B in capital costs in the TAMP are based on the 2006 Capital Budget and the related 10 year forecast from 2006 to 2015. The TRGP includes only the costs of growth construction while the TAMP includes capital costs for growth, rehabilitation and certain studies. The TRGP is based on the target of a 30% modal split while the TAMP is based on the financing sources and funding anticipated in the 2006 Budget.
During the implementation of these capital projects the following policies will guide the specific outcomes:
· Increase accessibility of all vehicles and facilities to meet requirements of the Ontarians with Disabilities Act – by planning to reach a fully accessible fleet by 2015
· Fleet Emissions Reduction Strategy – move to zero emission buses through phases,
· Improve the performance and efficiency of fleet, property and infrastructure management through continuous improvement reviews
· Purchasing through competitive mechanisms that streamline the process and reduce overall costs such as parts supply standing offers, P3 initiatives, and others.
Performance Measures
The Ridership Growth Plan contains a comprehensive set of performance indicators that are not repeated her. However, some performance measures are presented as a baseline for measurement of the objectives that are set out in this asset management plan. Over the course of the plan new measures may be developed or included. The following measures will show the magnitude of the system and the high level of efficiency in which it is operated.
·
Percentage
of Days Transit Bus Requirements Met
·
Percentage
of Planned Service Trips Operated
·
Kilometres
Driven per Bus Change
·
Efficiency
Indicator (OMBI) – Cost per kilometre – Transit Coaches
·
Spare
Bus Ratio
·
Safety
Tests
·
Environmental
Tests
Within this context assets are managed to mitigate the risks of service delivery failure to ensure that a safe, reliable, accessible and courteous service is delivered to 350,000 residents that choose to ride transit services every weekday.
Financial Implications
The Financial Program is based on the 2006 Capital Budget
approved by Council and the related 10 year forecast. The annual budget process will remain the City's principal forum
for deciding how to allocate available capital and operating funds. This process must consider not only the
availability of the required capital funding, but also the funding required to
operate and maintain the assets concerned.
The City has a Long Range Financial Plan (LRFP) to forecast the timing
of key expenditures over the next ten years and the need to allocate/generate
funds for these initiatives. This plan
serves as the basis of the annual capital budgeting process. The Transit Financial Program is
summarized in the table below. It
outlines the total of the forecast expenditures required and outlines how the
expenditures are projected to be financed.
Transit Financial Program Projected in 2006 - 2015
|
Future Public Transit Costs included in the 2006 Capital
Budget |
|||||
|
(2006 - 2015, $ millions) |
|||||
|
Cost Area |
2006 |
2007 |
2008 |
2009-15 |
TOTAL |
|
Light
Rail |
730 |
|
|
689 |
1,419 |
|
Transitway |
16 |
53 |
19 |
319 |
407 |
|
Buses -
refurbishment, replacement, growth |
37 |
71 |
12 |
280 |
400 |
|
Facilities
& Equipment |
14 |
59 |
5 |
121 |
199 |
|
Systems |
3 |
13 |
7 |
13 |
36 |
|
Park
& Ride Lots |
|
|
7 |
13 |
20 |
|
Total Capital Costs |
800 |
196 |
50 |
1,435 |
2,481 |
|
|
|
|
|
|
|
|
Funding Sources |
2006 |
2007 |
2008 |
2009-15 |
TOTAL |
|
Federal
Contributions |
233 |
40 |
10 |
472 |
755 |
|
Provincial
Revenue (other than gas tax funding) |
212 |
34 |
5 |
420 |
671 |
|
Debenture
Proceeds |
215 |
43 |
8 |
356 |
622 |
|
Development
Charges |
116 |
23 |
8 |
145 |
292 |
|
Provincial
Gas Tax (Gross) |
30 |
37 |
37 |
259 |
363 |
|
Provincial
Gas Tax Allocated to Operating Costs |
(7) |
(10) |
(37) |
(224) |
(278) |
|
Tax
Supported Reserves |
1 |
10 |
19 |
7 |
37 |
|
Other
Unspecified Revenue (1) |
|
18 |
|
|
18 |
|
Total
Funding Sources |
800 |
196 |
50 |
1,435 |
2,481 |
Note 1: The other revenue requirement refers only to
the West Transitway project. Staff is
pursuing senior level funding, that at the time of this report is not
confirmed.
Provincial gas tax is presented as projected annual gross
receipts, less the portion allocated to fund eligible operating budget
expenditures, including debt-servicing costs.
As first documented in the Long Range Financial Plan, the majority of
Provincial gas tax receipts in the outer years are projected to go towards debt
servicing.
While the provincial gas tax revenues are separately identified,
the other major contributions from the federal and provincial government are
the $400 million committed towards the current LRT project, and the expectation
of a comparable commitment to the East-West LRT line. Contributions from Development
Charges total $292 million of which the LRT project is allocated $109
million in the 2006 Draft Capital Budget.
The funds the city will borrow as debentures and contribute from current
tax revenues are also identified in the table.
The current Long Rang Financial Plan (LRFP) calls for an expenditure level beyond current resources. The LRFP will be refreshed during 2006, which is likely to lead to some changes in the plan for the latter years of the planning period. These changes will be reflected in the next TAMP.
The annual budget process will remain the City’s principal forum for deciding which projects will proceed according to available capital and operating funds.
In May 2004, the provincial government announced that two cents per litre of the existing provincial gas tax would be transferred to municipalities to assist in expanding and renewing their public transit system with the objective of increasing transit ridership. The provincial gas tax funding was phased in, starting with one cent per litre in October 2004, was increased to 1.5 cents per litre in October 2005, and will rise to two cents per litre in October 2006.
Ontario’s funding allocation formula is based on a ratio of 70 per cent ridership and 30 per cent municipal population. So far, the City has received $4.7M in gas tax funds for 2004 and $21.0M for 2005. It expects to receive $30M in 2006 and $37M in 2007.
The Gas Tax Agreement between the City and the Province of Ontario requires the City to develop and adopt a Transit Ridership Growth Plan and a Transit Asset Management Plan. These plans were to be submitted to the Province of Ontario prior to 31 March 2006 and must be submitted before future dedicated gas tax funds will flow. The TAMP submission is scheduled to occur prior to the next gas tax payment.
The Transit Ridership Growth Plan is being submitted separately to the Province. This is the Transit Asset Management Plan (TAMP) spanning a ten year timeframe, 2006 to 2015, which will be presented to Transportation Committee and Council for approval in principle prior to being submitted to the Province.
The City of Ottawa is home to about 850,000 people and covers about 2,760 square kilometres, of which 10% is urban land and the rest is rural. From east to west the City extends some 110 kilometres. Across the Ottawa River in the Province of Quebec, the City of Gatineau has a population of about 235,000 people. Ottawa-Gatineau is the fourth-largest metropolitan area in Canada after Toronto, Montreal and Vancouver.
Three different levels of government plan, design, build, operate and maintain transportation facilities within Ottawa. The City owns and maintains the rapid transit system and most of the road network, while major intercity Highways 416, 417 and 7 are the responsibility of the Province of Ontario. Some of Ottawa’s transportation infrastructure is under federal jurisdiction, including five interprovincial road bridges as well as roads and multi-use pathways belonging to the National Capital Commission. Within the city limits there are one international and three general aviation airports, two passenger railway stations, an intercity bus terminal, two ferries and a freight yard.
Ottawa’s extensive, multimodal transportation system includes transit service and facilities (on-road bus services, Transitway, O-Train, Park & Ride lots), walking and cycling facilities (on-road cycling facilities, 1,500 km of sidewalks, and 300 km of multi-use pathways), City, provincial and federal roads (6,000 km of freeways, arterials, collector and local roads), and parking facilities (with the City operating 15 off-street public lots with 1,600 spaces, and 3,750 on-street parking meters, mostly in and near downtown.)
The City of Ottawa’s transit service, known as OC Transpo, has 911 standard and articulated buses in active service with 765 vehicles in active service during the AM peak period. In addition to regular on-road bus services, the City has an extensive rapid transit system including 30 kilometres of exclusive busways known as the Transitway, 12 kilometres of freeway shoulder bus lanes, an eight-kilometre O-Train light rail line, and eight urban Park & Ride lots with over 4,400 parking spaces. The City operates a specialized transit service for persons with disabilities, known as Para Transpo, that uses a fleet of 92 dedicated wheelchair-accessible vans, 37 dedicated full-size sedans, and 30 taxis. In 2005, 56% of OC Transpo’s conventional transit fleet was comprised of fully-accessible low-floor buses.
The City of Ottawa is located on the south side of the Ottawa River, growing from the junction of the Rideau River and Rideau Canal with the Ottawa. The City slopes upward from the Ottawa River at a gentle grade. The City has developed in a grid pattern in the downtown core and within the area between the Ottawa River and Provincial Highway 417 – the Queensway. However, the street network has been influenced by the path of the rivers and some streets end at the rivers while others run parallel along their winding courses. Beyond the Queensway development has taken on a curvilinear pattern which represents the development style post World War II. With the amalgamation of 2001, the City, like the regional government which preceded it, includes extensive rural lands, particularly to the west and south which is approximately 90% of the City’s land mass. The creation of the Greenbelt by the National Capital Commission resulted in a large track of land between the inner City and the suburbs. This has meant that transit operations have had to bridge the greenbelt in order to deliver transit passengers from the suburbs to downtown. .
The weather is a major factor in the operations of a public transit system. For transit assets and their maintenance the mixture of weather and the way in which we attempt to mitigate the weather conditions are major contributing factors to asset depletion. While Ottawa is not the most extreme environment in which to operate a transit system the temperatures do vary widely. Ottawa temperatures can range from 33°C (91°F) in summer to -40°C (-40°F) in winter, with average summer temperatures around 20°C (68°F) and average winter temperatures around -10°C (14°F). Ottawa receives on average 730 millimeters of rainfall annually and 200 cm of snowfall annually
While radiation from the sun and rainwater build up do cause damage to asphalt, concrete, plastics, paint, wood and rubber components they do not take a toll like winter conditions. In particular the rolling stock and facilities are attacked by ice build up, frequent freeze/thaw cycles and the use of Sodium Chloride (NaCl), more commonly known as salt, to prevent slippery roads, parking lots, sidewalks and entrances.
Given the wide range of conditions and temperatures that our transit assets experience, it is necessary to enhance basic maintenance to address the different needs of the assets in summer versus winter and also have a wider range of equipment in order to deal with the seasons. For example, washing of the rolling stock for cleanliness and to remove salt buildup in winter requires special techniques. If an indoor storage facility cannot be used for washing and drying, then portable units need to be installed inside the vehicles to remove humidity. Otherwise, wet vehicles left outdoors or in unheated garages are likely to freeze up or have unsafe interior spaces for passengers. Outdoor bus storage has proven to be practical and cost effective with the development of appropriate techniques. Our experience has shown that start rates, defect ratios and repair costs are comparable to buses stored indoors. We are continuing to track the statistics and monitor the operation of the outdoor buses.
Even with our experience, unusual winter events can have significant impact on transit operations. The short heavy snowfall before and during morning rush hour December 16th, 2005 resulted in 107 buses being stuck or disabled, blocking many other buses, particularly on the Transitway. Typically for a significant snow event, Transit Operations would experience 10-12 requests for assistance from operators with stuck buses. Articulated buses were the most dramatically affected with 80% of stuck buses being articulated. This compares to an on-street fleet of articulated buses on December 16 of 22 percent. It is clear that these buses were more susceptible to becoming stuck in the large amount of snow experienced on December 16 than other bus types.
While this would be considered an operational issue it impacts vehicle buying decisions as well as planning and staffing decisions for support services. For this particular snow event considerable effort to free stuck buses was made by staff in many areas. Staff in Transit Operations worked with Fleet, RPAM, Surface Operations and towing contractors to free stuck buses.
There are three operations that comprise the public transit system in the City of Ottawa: Conventional Fixed Route, Light Rail and Specialized Transit. The Conventional Fixed Route service provides the bulk of the service both in terms of actual service hours/kilometres and in terms of ridership. Combined, these three services carry the highest per capita ridership of any similar sized City in North America. Higher ridership levels are generally only attained by much larger cities that provide an extensive heavy transit (rail based) service. The following tables, graphs and text will illustrate the resources used and the results attained by this combination of service methods.
Figure 1 – Conventional Transit Annual Linked Trips and
Kilometrage
* There was a 24-day
conventional transit labour disruption in 1996
The chart illustrates that transit use and service levels declined through the first half of the 1990’s to a bottom in 1996 that was emphasized by the results of the labour disruption. Since that time, both service levels and ridership has been steadily increasing. The table on the following page provides more detailed data. Some key indications include:
q Conventional transit service provided about 2.3 million service hours in 2004 which represents a ten-year increase of 9%. Actual service capacity has increased by a greater margin, because the proportion of articulated buses in the fleet has increased.
q Total conventional transit ridership in 2005 was about 90 million linked trips or 25% greater than in 1995, when ridership reached its lowest point in 20 years.
q Per-capita conventional transit ridership in 2005 was about 118 trips per resident served — more than all Canadian cities except Montreal and Toronto, and more than all North American cities of a comparable size. This represents an increase of 4.4% over the 1995 figure of 113 trips per resident served.
q Conventional transit fleet size in 2005 was one mini-bus, 683 standard and 227 articulated buses, compared to 682 standard and 108 articulated buses in 1995. Fleet carrying capacity (as measured in standard equivalents, where an articulated bus represents 1.5 SE compared to 1.0 SE for a standard bus) was 1,025 SE in 2005, up 21% from 844 SE in 1995.
q Conventional transit operating costs and revenues have both generally increased over the last 15 years, increasing 62% and 46% since 1990, respectively. The relatively greater growth in costs has led to a falling revenue-cost ratio, from 58% in 1990 to 51% in 2004.
q Average system speed is 24 km per hour.
Figure 2 Table of
Conventional Transit Service
|
Year |
Total Bus Kilometrage
(000) |
Annual Linked Trips
(000) |
Total Platform hrs.*
(000) |
Rev. Riders per Capita |
UTA Population |
UTA Size (sq kms) |
|
1990 |
50,730 |
80,654 |
2,193 |
138 |
586,430 |
358.5 |
|
1991 |
51,095 |
79,227 |
2,222 |
133 |
594,900 |
358.5 |
|
1992 |
50,996 |
78,636 |
2,196 |
130 |
603,800 |
367.1 |
|
1993 |
49,621 |
76,051 |
2,119 |
123 |
616,200 |
367.9 |
|
1994 |
48,433 |
73,367 |
2,112 |
117 |
625,800 |
367.9 |
|
1995 |
48,483 |
71,754 |
2,097 |
113 |
635,500 |
368.4 |
|
1996 |
42,701 |
64,812 |
1,839 |
100 |
645,000 |
368.4 |
|
1997 |
45,233 |
69,972 |
1,918 |
107 |
653,700 |
368.4 |
|
1998 |
45,818 |
70,374 |
1,940 |
106 |
663,000 |
368.4 |
|
1999 |
48,043 |
74,721 |
2,041 |
111 |
672,600 |
368.4 |
|
2000 |
50,023 |
80,000 |
2,129 |
115 |
695,000 |
377.9 |
|
2001 |
52,453 |
84,735 |
2,225 |
119 |
709,400 |
377.9 |
|
2002 |
53,030 |
86,761 |
2,247 |
120 |
723,800 |
397.0 |
|
2003 |
55,330 |
87,941 |
2,308 |
119 |
737,000 |
397.0 |
|
2004 |
55,625 |
88,780 |
2,299 |
118 |
751,000 |
397.0 |
* Platform hours refers to total scheduled
hours including revenue hours, deadhead hours and “extras” required to spport
service, but excludes charter or special events service.
The Light Rail Pilot Project was initiated in 2001 and shows continuous growth in ridership since that time.
Figure 3 Light Rail
Passengers Carried and Service Hours
|
Year |
2002 |
2003 |
2004 |
|
Annual Passengers Carried |
1,298,600 |
1,434,745 |
1,700,000 |
|
Annual Services Hours |
19,378 |
18,513 |
20,257 |
Specialized Transit, Para Transpo, provides a scheduled service to persons with accessibility challenges that would impede them from riding the conventional fixed route services. The following illustrate the resources expended and the results attained.
q Specialized transit ridership in 2004 was just over 750,000 trips, which is 60% higher than it was in 1990. However, ridership levels have been relatively unchanged since 1994 with the exception of 2001, when there was a lengthy labour disruption.
q Specialized transit operating costs and revenues have increased by 19% and 12%, respectively, since 1995.
Figure 4 Para
Transpo Total Kilometrage and Ridership
*There
was a 68-day specialized transit labour disruption in 2001
Figure 5 Para Transpo Total Kilometrage and Riders
|
Year |
Total Kilometrage
(000) |
Riders (000) |
Total Hours (000) |
Riders per Total hrs |
|
1990 |
4,770 |
472 |
245 |
1.93 |
|
1991 |
5,438 |
540 |
289 |
1.87 |
|
1992 |
6,369 |
627 |
345 |
1.82 |
|
1993 |
7,218 |
706 |
376 |
1.88 |
|
1994 |
7,517 |
734 |
373 |
1.97 |
|
1995 |
7,637 |
759 |
378 |
2.01 |
|
1996 |
7,955 |
742 |
385 |
1.93 |
|
1997 |
7,496 |
758 |
380 |
1.99 |
|
1998 |
8,115 |
735 |
385 |
1.91 |
|
1999 |
8,678 |
727 |
391 |
1.86 |
|
2000 |
9,172 |
752 |
380 |
1.98 |
|
2001 |
7,364 |
599 |
322 |
1.86 |
|
2002 |
8,327 |
725 |
376 |
1.85 |
|
2003 |
7,810 |
721 |
341 |
1.89 |
|
2004 |
7,920 |
755 |
353 |
1.93 |
There are a number of unions representing the workforce providing transit service in Ottawa, including:
q Amalgamated Transit Union (ATU) Local 279 and 1760 – Bus Operators, Transit Administrative Staff, Fleet Services and Supply Management Staff)
q Canadian Union of Public Employees (CUPE) 503 and 5500 Supervisors, Planners, Security, Administration and Technical
q Civic Institute of Professional Personnel (CIPP) – all Professional salaried staff.
It should be noted that City of Ottawa transit workforce management is complicated by the need to determine which jurisdiction governs, Federal or Provincial, due to the inter- provincial operation of the service. Decisions and activities that cross these scope boundaries do limit the pace of progress. However, there are mechanisms in place to resolve scope issues. It just takes extra time and effort that would not be required where there were fewer bargaining units and unions.
Within the maintenance force for Fleet Services there are several issues that impact on the ability to provide vehicles for service delivery. Similar to other industries and departments within the City there is a large segment of the workforce that is eligible for retirement or earlier retirement in the next 3 to 10 years. In most circumstances succession planning will mitigate this issue. However, Fleet Services has experienced difficulty in recruiting qualified 310T maintenance technicians. The number of qualified applicants is lower than in past years. Similarly, where Fleet Services historically recruited from local private businesses, the private sector has become more attractive and technicians are choosing to stay with their current employer. This is addressed through improvements to apprenticeship programs. Recruiting entry level staff from within the applicable union bargaining unit has historically been the pool from which the apprenticeship program operated. The time to license an employee ranges from 3-5 years depending on their qualifications. Organizationally, and in consultation with the union leadership, the City needs to pursue alternative Technical recruitment alternatives. This may include partnerships with local educational institutions and modifying apprenticeship entry guidelines to make the trade more appealing to automotive technicians.
The evolution of vehicle system technologies is quickly changing traditional maintenance processes. New vehicle technologies, including hybrid systems, will result in increased pressures to invest in building and material upgrades and training programs for all staff, to enable effective and efficient maintenance and servicing.
In addition to staying current with new bus technologies the Fleet Services workforce also needs to enhance/focus its skill development in the following areas: problem solving; computer skills for diagnosing technical problems, using fleet management information systems effectively; self awareness and ability to work independently.
The ability to operate a large public transit service, such as the City’s, requires a network of suppliers for vehicles, a wide range of replacement parts for vehicles, building components, service contracts, and human resources. In this section we will identify some of the supplier arrangements in several broad categories as well as some of the strengths and weaknesses of those arrangements.
The rolling stock for the conventional routes, buses, requires a dedicated staff of maintenance professionals as well as an efficient and effective support unit that can provide the necessary components in a timely and cost efficient manner to keep these vehicles on the road. The average age of the Transit fleet was 8 years old in 2005. Maintaining this size of a fleet comprised of a wide array of bus manufacturers, models and years requires an elaborate process to track purchases, inventory quantity and location in the stockrooms, make projections of future needs and to appropriately rationalize existing stock levels.
In some cases we have
a competitive number of parts suppliers such as Orion, Prevost, MCI, New Flyer
and Surgenors for coach and automotive components. GMC Classic replacement components and Cummins Diesel engine
components are also competitive.
Difficulties occur with Manufacturers, including some of those above,
who design proprietary parts. This
results in some particular part categories/segments having limited competition
- Motors, transmissions and axles are usually concentrated with 2 manufacturers
and their dealer/warranty organizations.
There has been a dependence on one manufacturer to provide the
articulated buses that are becoming a larger percentage of the bus fleet. Coupled with the issue of prices for parts
is an equally important criterion which is availability. Quoted prices may be competitive but the
delivery times are not reasonable for our maintenance needs. We also experience part availability issues
with new bus purchases as the manufacturers may not have produced an adequate
supply of all parts for newly manufactured vehicles. This can result in new vehicles that may be involved in an
accident early in their service life sitting idle while replacement parts are
manufactured.
The City has recently
adopted a purchasing process that expedites the quoting of prices through the
use of standing offers. This tool
allows the purchasing clerks to reduce time in selecting the most appropriate
supplier based on price and shifts the focus on delivery and quality of the
part. Some standing offers require
suppliers to carry a predetermined level of inventory to support Transit
operations. Currently, over 100
standing offers are in place for various commodities, including fleet and
transit parts, not only as a cost savings initiative, but also as a guarantee
of delivery and availability.
The City has adopted a review process that has been implemented across the corporation to determine the best method of service delivery for all municipal activities. This process determines what activities should be carried out in house, and what activities should be outsourced. In transit, the City utilizes contracted resources to operate and maintain the entire Para Transpo service using vehicles owned and maintained by the contractor. The preferred vendor was selected through a request for proposal process which included an in-house bid. Some of the tasks involved in the major bus rebuild program that Fleet Services conducts have been provided by third parties through a tender process, and some maintenance on the articulated buses that a contractor has provided during the warranty period continue to be provided by the contractor as the warranties expire. Most of the capital work on facilities is contracted to outside companies through either request for proposals or tenders. In addition an extensive array of service contracts are used for many of the specialized skills for property management and maintenance such as Glazing repairs, Elevator/Escalator Maintenance, Fire Hydrant Maintenance, Fire Protection System Maintenance, Fire Extinguisher Inspections, Pest Control, Snow/Ice Maintenance, Landscaping Maintenance, Building Control System Maintenance, Roof Inspections, Environmental Inspections and Reporting, Hoist Inspections, Methane Sensing System Maintenance.
The light rail project is being developed under a Public-Private Partnership. The contractor will be required to design and build the facilities, provide the vehicles and maintain the vehicles and facilities for a 15 year period. City employees will operate the service.
City Council sets transit policies, budgets and guides the implementation of service. The responsibility to deliver public transit service is shared among a number of city departments and branches based on their functional expertise. The Director of Transit Services is responsible for operating the transit system within the set policies and budgets, and reports to the Deputy City Manager, Public Works and Services (PWS), who in turn reports to Transportation Committee and Council. The key responsibilities of Transit Services and the other departments, branches and divisions involved are set out below:
Public Works and
Services
q Transit Services – Transit Services is responsible to plan and deliver a quality transit service which is reliable, accessible, cost effective, safe, courteous and offers residents a high level of mobility. It operates two types of services, the regular transit service (buses and light rail) and specialized service for persons with disabilities (Para Transpo). This Branch is comprised of two divisions and one unit.
o Transit Operations - The Transit Operations Division is responsible for all on-street service operations and supervision. The Division has responsibility for the safety and security of customers. They operate a 24/7 service control centre, responsible for service and security control. The Control Centre is equipped with a vehicle monitoring service control software system that assists staff in managing the service.
o Transit Service Planning and Development – Transit Services Planning and Development is responsible for transit route planning and scheduling, public information and customer relations, business development, pricing policy and the distribution of transit fares and the O-Train operation. The transit call centre is located alongside the operations control centre. This division relies heavily on technology to maximize the efficiency of bus and operator work schedules. It maintains an automatic data collection system which provides comprehensive information from bus and train operations for service analysis.
o
Para Transpo - A separate unit controls and administers Para
Transpo services. A private contractor
provides on the street service as well as maintenance of the fleet.
q Fleet Services - Is responsible for acquiring and supporting safe and reliable
vehicles and equipment to City Departments.
As well, they have the responsibility to dispose of vehicles taken out
of the active fleet. Within the Branch
are four divisions which directly support public transportation and the
management of transit assets. These
are:.
o Transit Fleet Maintenance –It operates a 24 hour/day, 7-day/week operation, operating from 3 facilities and is responsible for the maintenance of the transit bus fleet of more than 900 buses. Transit Services perform the required preventive and corrective maintenance, as well as seasonal servicing. It performs Ontario Ministry of Transportation (MTO) inspections, administer warranty issues and provide mobile/on the road support services. In order to ensure an on-going rejuvenation, and thereby maintain the required level of reliability of the transit bus fleet, Transit Fleet commission and decommission vehicles on an 18-year life cycle. On a day-to-day basis it ensures the buses are fuelled, cleaned, and ready for morning and afternoon peak service. The body shop looks after any minor external defects, and plays a major role in the refurbishing of buses. Transit Fleet Maintenance carries out the overhaul of all major bus components such as engines and transmissions, as well as a large portion of other bus components. Currently Transit Fleet Maintenance focuses on the fixed route rolling stock. Specialized transit maintenance is performed by the contracted operations and light rail maintenance is performed by contracted services.
o
Technical Services –It provides the technical services
required to operate the transit bus fleet.
This includes assessing equipment efficiency, life-cycle analysis,
vehicle and equipment safety requirements, development of specifications as per
requirements, development of refurbishing plans, licensing and overall Fleet
performance. Fleet inventory management
is an essential part of its mandate. Technical Services manages the tendering,
acquisition and disposal process Its staff keep abreast of new developments in
design, availability, safety and other industry and legislative developments to
enhance the overall performance and safety of the Fleet.
o
Operational Support and Policy –The role
of operational support and policy is to provide support services to Transit
Operations and Transit Fleet Maintenance. The management of fuel services,
compliance to the provincial Commercial Vehicle Operator Registration system,
customer billing, and fleet policy development are all part of its
mandate. It produces detailed reports
and business planning information and analysis for both the Fleet Services
Branch, and for City departments. It
analyzes business processes, assess’ the Branch's performance and looks for
ways to improve the Branch's service delivery. It also carries out an an annual
review of billing rates and structure.
o
Municipal Fleet Maintenance – It is responsible for
the maintenance of the auxiliary fleet transit.
q Infrastructure Services Branch – manages the roadway and bridge structures required to support the transit system.
q Surface Operations – provides road and sidewalk maintenance activities of the City
streets and the Transitway.
q Traffic and Parking
Operations - manages traffic operations, including
Transit Priority and the Transitway traffic control.
Corporate Services
q Financial Services
o Supply Management – Supply services includes the provision of parts, uniforms and tools to Fleet Service staff (mechanics) through ordering, stocking and site management of Stores locations. Uniforms for Drivers and RPAM maintenance items are also carried and managed by Supply. Supply Management also conducts the procurement procedures for fleet purchases and all other asset procurements - facilities, IT equipment, service contracts, stores/parts, etc....
o Financial Support Unit – Managing all aspects of the budget and preparing the corporate financial plan to ensure the long-term fiscal strength of the City are primary functions of the Financial Services branch. The branch produces the annual operating and capital budgets, provides annual financial status reports to management and Council, manages the short and long-term investment of the City's funds and manages the issuance and repayment of the long-term debt program to support the City's capital budget program. In addition, the branch plays a crucial role in providing financial processing, analysis and support to departments. It also provides accounting and financial reporting service for the City and establishes financial policies to ensure control over the City’s assets. Financial Services also oversees the administration of the purchasing of all goods and services and the operation of all inventory locations for the City.
q Real Property and Asset
Management – Ensuring the
safety and long-term viability of City assets is the core function of the Real
Property Asset Management (RPAM) branch.
As the corporate landlord, RPAM is responsible for managing all Transit
property and providing turnkey property management services. The branch is responsible for setting
policies and standards for all corporate landlord activities. Real Property Asset
Management Branch, through its Comprehensive Asset Management Division, ensures
that buildings are able to provide continuous uninterrupted support to City
programming by developing and implementing a specific life cycle renewal plan
for each building and building component.
These life cycle renewal plans are based on planned uses, strategic
asset management reviews, the validated condition of the building, as well as
input from the users and operating staff of the facility. This includes lease negotiation, land
purchases, maintenance (inside and out), capital budgeting and operating of the
facilities. It maintains Transitway
stations, shelters, bus-stop markers and information panels, offices, garages
and park-and-ride lots.
q Information Technology – core functions include managing the City’s technology infrastructure (computer equipment, voice/data networks and telecommunications systems), supporting corporate and departmental business systems, and support business applications (including enterprise-wide systems such as SAP) which provide vehicle information,, route planning and scheduling, automatic passenger counting system as well as radio communications and Global Positioning System (GPS). This includes IT software and hardware used for Para Transpo and the Light Rail.
q Employee Services Branch –provides the human resource policies, plans and
processes that enable the corporation to fulfill its mandate. Of equal importance is the management of labour
relations with the City’s eleven collective
bargaining units, and of managing issues related to employment equity, human
rights, diversity, bilingualism, accessibility and fair treatment of all
employees. To provide a safe and
healthy work environment for all employees, this branch manages all health,
safety, employee assistance and wellness policies and programs. It also works to minimize and eliminate
workplace injury and occupational disease, and ensures the timely return of
employees back into the work environment.
The branch is responsible for developing and managing the City's
compensation program, the City's job evaluation and pay equity systems, the
employee benefit plans and administering the City's pension plans.
q Client Services and Public
Information Branch – is to deliver
services to citizens through the City’s four service delivery channels: the
City’s contact centre (call centre), seven public counters, the City’s Web
site, and e-mail. The service delivery
model is designed to respond to our citizens’ and business owners’ preferences
for using lower cost, self-serve options. It also provides
the marketing and communications functions managing advertising contracts.
Planning and Growth
Management
q Planning, Environment & Infrastructure Policy - develop, update, implement and monitor the Transportation Master Plan. They perform environmental assessments for capital projects identified in master plans and investigate and pursue funding sources.
q Economic Development & Strategic Projects – are developing the City’s light rail transit system in accordance with the environmental assessment and to further the City’s Environmental Strategy and City Corporate Plan Smart Growth Agenda.
City Council sets transit policies and guides the implementation of service. The Director of Transit Services is responsible for operating the transit system within the set policies and budgets, and reports to the Deputy City Manager, Public Works and Services (PWS), who in turn reports to Transportation Committee and Council. The Director of Fleet Services reports to the Deputy City Manager, Public Works and Services (PWS), who in turn reports to Transportation Committee and Council and for issues related to fleet renewal. It also reports to Corporate Services and Economic Development Committee on areas within its mandate.
There are a large number of legislative requirements which apply to aspects of the transit operation, including:
q Occupational Health and Safety Act
q Canada Labour Code
q Accessibility for Ontarians with Disabilities Act 2005 -CSA B651 Barrier Free Design
q Ontario Building Code
q Ontario Bridge Design Code
q Canada Building Code
q Elevating Devices Act
q Environment Protection Act
q Ontario Water Resources Act
q Procedure for the Handling and Disposal of Selected Wastes form Motor Vehicle Servicing Facilities, prepared by the Ministry of Environment
q Municipal Sanitary Sewer-Use By-Law
q Ontario Regulation 127/01, Ministry of Environment
q Ontario Technical Standards and Safety Act, 2000, TSSA
q Liquid Fuels Handling Code, LFHC
q Ontario Regulation 347
q Transportation of Dangerous Goods
q Federal and Provincial Labour Code
q Highway Traffic Act
q Motor Vehicle Safety Act
q Railway Safety Act
q Canadian Environmental Protection Act
q City Purchasing By-law
q City Budget
The legislative environment in which the City of Ottawa operates its transit services is more complex than most given that it is governed by both Provincial and Federal legislation. This is a result of OC Transpo vehicles traveling across the Ottawa River into Gatineau, Quebec. Societé de Transport de l’Outaouais (STO) vehicles (which service Gatineau) are governed in the same manner. As a consequence, Federal labour legislation guides labour relations for transit employees, rather than provincial legislation. Federal legislation also controls the light rail operations as they are considered railway rather than transit services.
Key legislative provisions that impact particular areas of Ottawa’s transit asset management activities include:
q Conventional Transit Fleet
and Maintenance legislative requirements:
Perform legislated preventative maintenances inspections in accordance with the Commercial Vehicle Operator’s Registration requirements under the Ontario Highway Traffic Act (HTA).
Meet accessibility requirements of Regulation 629 of the Ontario HTA
Adhere to the Canadian Environmental Protection Act for use of ultra-low sulphur diesel fuel by June 2006 in all on-road diesel fuel vehicles.
q Light Rail Fleet and
Maintenance legislative requirements:
Federal License: The O-Train currently operates as Capital Railway under Certificate of Fitness No. 00002-1 dated August 30, 2001 issued by the Canada Transportation Agency (the "Agency") and it is regulated by the Agency and Transport Canada.
The City of Ottawa is seeking an exemption from the Canadian Transportation Act so that the LRT system can run under municipal regulation, as is the case for other LRT systems in Canada (e.g. Calgary and Edmonton).
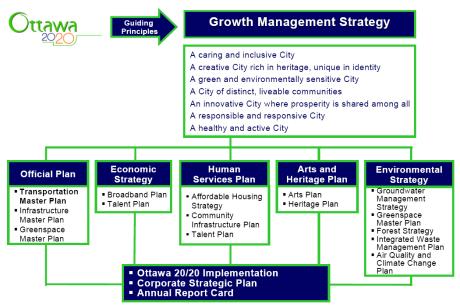
In 2001, City Council
initiated the Ottawa 20/20 initiative, a two-year process to guide growth and
development of the city over the coming decades. It strove to balance social,
environmental and economic issues in a way that will serve current residents
while being responsible to future generations. It incorporated several new
growth management plans (Official Plan, Human Services Plan, Arts and Heritage
Plan, Economic Strategy, Environmental Strategy, Corporate Strategic Plan) that
identify the City's long-term strategic directions and form a comprehensive
blueprint for the future of Ottawa.
The Official Plan
directs Ottawa’s physical development through land use, community design,
transportation and infrastructure policies. It is supported by the strategies,
policies, programs and infrastructure elements recommended in three master
plans, namely the Transportation Master Plan (for multimodal transportation
services and facilities), Infrastructure Master Plan (for water, wastewater and
stormwater services) and Greenspace Master Plan (for the protection,
acquisition and management of greenspace). The figure below shows how these
plans relate to the other elements of the City’s growth management strategy.
The Transportation
Master Plan will help the City of Ottawa manage growing transportation demands
over the next two decades. It identifies transportation facilities and services
that the City intends to put in place by 2021 to support the development
pattern identified in the Official Plan, and to meet the travel needs of
residents and businesses. Its policies guide the operation of the City’s
day-to-day transportation programs, and provide a basis for capital and
operating budgets.
Figure 6. – Ottawa 20/20 “Document
Road- Map”
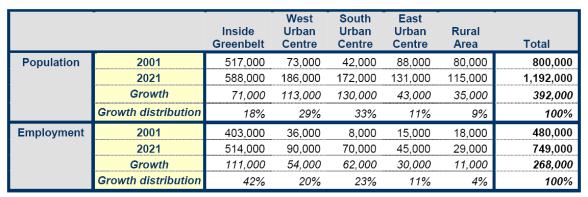
The City of Ottawa
expects to see substantial population and employment growth by 2021, with new
residents and workers placing considerable pressure on its transportation
system.
The following figure shows
that the city’s population is projected to grow almost 50% from 2001 to 2021.
Of the almost 400,000 new residents, 18% will live inside the Greenbelt while
73% will live in urban areas outside the Greenbelt, and 9% will live in rural
areas. The number of jobs is projected to grow by about 270,000 or 56% from
2001 to 2021, with 42% of new jobs located inside the Greenbelt, 54% in urban
areas outside the Greenbelt and 4% in rural areas.
Figure 7. – Population and Employment Trend
Because of the aging
population and a declining number of people in the average Ottawa household,
the number of households in Ottawa is projected to increase by up to 60%
between 2001 and 2021, including many more seniors' households. This means that
almost 190,000 new homes will needed. About two-thirds of them will be outside
the city's Greenbelt, where fewer than half (about 40%) will be townhouses or
apartments. About one-third of new homes will be inside the Greenbelt, where
most will be apartments.
In order to reflect
its growth management principles and support for the Official Plan’s desired
land use patterns, the City of Ottawa is planning to achieve the highest
reasonable level of future transit usage. During the Transportation Master Plan
process a 30% transit modal split objective was set for the 2021 afternoon peak
hour, meaning that 30% of all motorized person-trips (i.e. those made by
transit or automobile) would be by transit and 70% would be by automobile. This approach was adopted to reduce the
requirement for increased road capacity and the community disruption that would
result from road expansion and new road corridors.
Achievement of the
transit modal split target will have a significant effect on total transit
ridership. Afternoon peak hour person-trips by transit will almost triple,
rising from 37,000 to 104,000. At the same time, afternoon peak-hour person
trips by auto will increase by just 30%.
Figure 8. – Person Trips by Mode
These peak hour increases, translated into equivalent growth in annual transit ridership, provides 2021 targets of about 240 million linked transit trips per year (versus 85 million in 2001) and about 210 trips per capita annually (versus 119 in 2001). The required growth in annual transit ridership to meet the target of 240 million trips, starting from the 2004 ridership of 88.8 million trips, represents a compounded growth rate of 6% per year, as illustrated in the following figure.
Figure 9–Conventional Transit Ridership
Transit Services is moving to implement a number
of projects to improve transit efficiency and effectiveness, and is evaluating
further options. The transit asset
management plan is based on a number of assumptions regarding these future
directions and decisions. Some of the
assumptions that will affect purchasing, financial arrangements, and operations
are detailed below with respect to the asset management plan.
q All new conventional bus purchases will be accessible, low floor vehicles, with a goal to achieve a fully-accessible conventional bus fleet by around 2015. The current financial plans indicate the bus fleet will be 87% accessible, low floor vehicles by 2015. This will support other services and features to increase the use of conventional transit service by customers with disabilities
q Fuel use within the current fleet is diesel and it is expected that the 2006 and 2007 replacement and growth vehicles will rely upon current fuel technology. Fleet Services is conducting a study to evaluate compressed natural gas (CNG) and diesel-electric hybrid technology. The study results will be factored into future bus purchases. Fleet Services will monitor developments in other technologies such as fuel cell technology, etc. over time.
q Fuel use – biodiesel with blended content of 5, 10 and 20 percent has been studied as part of the Fleet Emission Reduction Strategy. This will not affect capital spending but may impact operational expenditures.
q Another part of the Fleet Emission Re-education Strategy is the installation of Diesel Oxidization Catalytic Converter installation on pre-1994 buses through an Environment Canada Program. There were 25 buses completed in 2004 and 30 more are scheduled for 2006.
q The “SMART BUS” initiative involves using technology to improve operational control and customer service. Wireless bus sub-system information management will, at a basic level, gather mileage, fuel consumption, oil consumption, tire pressures and basic status codes. At higher level, it will accommodate bus condition monitoring sub-systems, uploading and downloading operational information for each bus (such as route designation), uploading maintenance codes and bus historical data, etc. It is expected that all new purchases will comply with this requirement as well as a retrofit program. The components have been designed to accommodate other functions as described below.
q Double-decker buses and other bus rapid transit vehicular solutions are under examination and may change the Fleet Renewal Plan. These are noted but no specifications have been developed for the best configuration for the Ottawa Transit Market.
q Additional maintenance garages will be required in upcoming years to accommodate fleet growth. The next new garage is slated to be built during 2007-8.
q Outdoor bus parking and the approaches required to use it effectively, have been developed, with over 100 spots available as plug-in at the present time. Its use is expected to increase as a result of recent studies to compare outside starts versus indoor starts, replacing reliance on indoor parking.
q Corrosion prevention program is in development and this may have impacts on future bus purchases and maintenance programs.
q “SMART BUS” using on-board GPS and transponder technology to enable more efficient use of fleet resources allowing real time tracking and supervision, improve schedule adherence and provide better information to customers, among many other benefits. For example, the GPS system will be used as a basis for ‘Next Trip’ displays at transit stops as well as ‘Next Stop’ announcements on-board vehicles.
q The GPS wireless sub-system will also support a smart card fare system which is currently under development and will be compatible with the STO smart card system.
q Using GPS technology on-board Para Transpo’s wheelchair-accessible vans will improve the efficiency and effectiveness of scheduling and dispatching.
q Implementing transit priority measures in a network of key corridors and elsewhere in the system.
q Connections between transit services and other travel modes will be improved through enhanced facilities at and around stations, and through rapid transit expansion to Ottawa’s international airport.
q Expanded patrols and remote surveillance of transit facilities and vehicles will enhance public safety and security. In particular some assumptions have been made about the requirements for Federal funding for increased use of CCTV in Transit Stations etc… in order to prevent terrorist activity.
Ottawa's public transportation system, including OC Transpo, the O-Train and Para Transpo, delivers a safe, reliable, accessible and courteous service to 350,000 residents every weekday. The City has invested considerable resources in Ottawa's public transportation network, making it one of the best in North America. The Transit Asset Management Plan is the articulation of objectives contained in broad documents such as the Ottawa 20/20, Transportation Master Plan and others such as the City Corporate Plan CCP), Departmental Business Plans (DBP) and the Branch Business Plans (BBP) in terms of good management practices for assets and capacity as well as strategically understanding the capacities and assets that are needed for the future.
The plan is based on three key priorities:
The most visible assets of the transit system are its
rolling stock and the stations that we use for boarding and alighting. Sustainable funds are required to maintain
and renew these and other assets over time to ensure that they will continue to
provide the capacity that is required at the lowest possible life cycle cost.
The expected life of a transit bus is 18 years based on 12 years from the Original Equipment Manufacturer (OEM) and six years after refurbishment, as required by the Ministry of Transportation under the Ontario Transit Vehicle Program (OTVP). Under the OTVP, the City receives 33 per cent of the capital cost of a replacement bus and 33 per cent of the cost of the 1st refurbishment
The Capital Program contains $66M for Bus Refurbishment over the life of the TAMP which is projected to refurbish 493 buses. There are approximately 176 buses in the current fleet which will be retired at the end of their useful life and replaced with new revenue buses with an estimated capital requirement of $135M.
From a facilities standpoint, RPAM will implement the three phases of the Comprehensive Asset Management Strategy in 2006 as part of its Departmental Business Plan which will take into account transit facilities and the maintenance facilities. Life Cycle Renewal and other transit facility work will require $41M in funding. There is a capital requirement for $140M for transit garages during the TAMP timeframe which will include two garages with one of those garages completed during 2007-8. Bus equipment within these facilities will be $17M.
In addition to the dedicated transit corridors a significant amount of transit ridership is carried on the road network. Ensuring that this asset is maintained to an acceptable level is also key to passenger safety and comfort. The Transitway provides a vital link to the downtown core and across the City from East to West or North to South. Significant rehabilitation will take place with $7m in work planned.
A number of projects in the Capital Plan aim to improve operations and passenger amenities through refinements of the rolling stock, stations, and technology interfaces. Transit Computer Systems New Initiatives and Integrated Transit Control Centre will require $24M in planned funding.
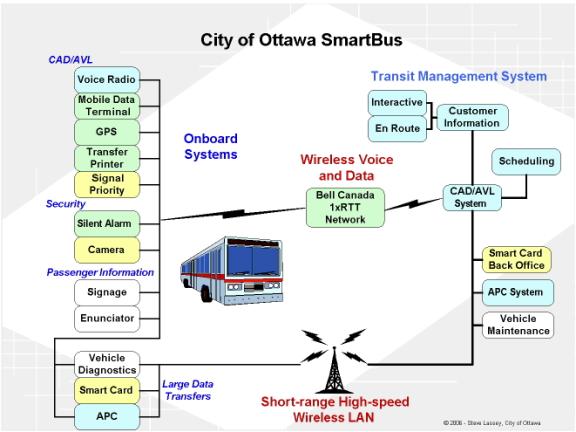
A key foundational enhancement for transit service provision in Ottawa will be the implementation of the Smart Bus Information System (Global Positioning System (GPS) & Mobile Data Terminal (MDT)) which will be completed in 2006. This will improve operational on-time performance, customer information, optimize bus resource allocation and reduce overall costs through enhanced fleet monitoring capabilities. It will facilitate enhanced customer amenities that will be possible because of the installation of this backbone across the fleet and the transit network. This enhanced customer service amenity initiative requires $380,000 in funding for realization. The overall direction of the Smart Bus program is illustrated in the diagram below.
Figure 10 – Smartbus Initiative
The initial steps in the implementation of the “Smart Card” electronic fare system will be taken in 2006 with the issuance of a request for proposal. This is a foundation of the fare system that will be in place for the commencement of light rail operations on the North-South line in 2009. This initiative requires $11.6M in funding for realization.
Technology will also enhance the efficiency and the effectiveness of Para Transpo operations through the implementation of Interactive Voice Response (IVR) system to allow customers to cancel bookings at any time, allowing vehicles to be reassigned to other tasks and improve overall service. This Service Action is slated for completion in 2006 requiring $125,000 in funding.
Roads play an integral role in the provision of public transit. Transit priority measures are proposed to improve the efficiency and effectives of bus operations in mixed traffic, and at interfaces between dedicated facilities and the public roadways.
An important part of transit operations is security. Transit customers security needs are addressed through a combination of measures: transit facilities and designed to CPTED standards (Crime Prevention Through Environmental Design); emergency alarms are placed throughout each transit station that are directly connected to the central security control; many stations are equipped with CCTV which is monitored by the security control staff; and Transit Law Enforcement Officers patrol the Transitway system and provide a visible security presence.
In the most important project aimed at expanding system capacity is the development of the North-South light rail transit line, which will be realized in the TAMP timeframe, and continued work on the addition of the East West light rail line. The procurement process for the new light rail system is being managed through the Planning and Growth Department and is identified in its Departmental Business Plan as a key supporting objective of the Transit Ridership Growth Plan. The system is being procured as a public-private partnership as a Design, Build, Maintain contract, with the contractor responsible for maintenance for 15 years after system start up. The contractor’s maintenance responsibilities extend to life cycle maintenance.
Implementing the North-South Light Rail Transit project will facilitate rapid travel from South Nepean and Riverside South to downtown. This project, initiated in 2005, will be in operation in 2009. The Economic Development and Strategic Projects branch is leading this procurement initiative. In 2006, a public-private partnership agreement will be executed for the implementation of this project and construction will be initiated. The Capital Program has allocated $1.42B for the realization of this initiative.
Preparations for light rail integration and expansion of the Transitway will require a capital outlay of $43M during the TAMP. This will cover projects such as the Transitway expansions for the West (Bayshore to Pinecrest), the SouthWest (Fallowfield), Cumberland, West Corridor/Terry Fox-Eagleson, park and ride lots, EA studies and protection of future corridors will require $363M in funding.. Park and Ride facilities will also be expanded with $20M in capital work planned.
During the timeframe of the TAMP there will be an additional investment of $199M in new buses that will enhance the capacity of the fleet. The fuel type and configuration as well as new passenger amenities will be evaluated at the time the procurement order is competed.
In total, the Transit Service provision allocated to meet the goals of the TRGP will require $2.48B in capital funding.
This section described the assets used to deliver the “Current” level of transit services. Section 6, the Capital Plan identifies those assets that will be required to replace/refurbish these existing assets as well as additional assets required to ensure that the capacity is present to deliver the transit services of the “Future”.
Only the assets used directly in the delivery of services are listed. However, the assets that have been included are only those that are directly owned by the City in terms of property, vehicles and supporting infrastructure. Reference should also be made to Section 1.1.8 Governance in which the Centres of Expertise that support the delivery of transit services are described. These areas have assets that are used to support transit and other service delivery operations. These assets have not been directly included in the baseline inventory of assets.
The City has 920 transit buses with a current replacement value of $516M and with a current average age of eight years Standard forty-foot buses represent 75 per cent of the fleet while articulated sixty-foot buses represent 25 per cent of the transit fleet. (For a detailed inventory see Appendix B) The projected replacement funding for 2006 will replace 36 low-floor diesel buses at a cost of $18 millions. The steady state replacement model based on an 18 year expected life or 5.5% of asset value would replace 51 vehicles annually at a current cost of $26 millions.
Figure 11–Bus Fleet Inventory
|
BUSES |
Quantity |
Replacement Value
(000) |
Average Age |
Accessibility |
|
40' Standard |
692 |
$352,920 |
9.6 |
41% |
|
60' Articulated |
227 |
$162,986 |
3.0 |
100% |
|
Mini Bus |
1 |
$105 |
0.0 |
0% |
|
Total Active Buses |
920* |
$516.011, |
8.0 |
56% |
There
are 911 “active” buses, with 9 buses out of service for various reasons.
A cost effective vehicle replacement program is essential to proper fleet management. Reliable, safe and accessible vehicles are essential to the City’s efficient and effective service delivery to the public. Vehicles that are held too long have little or no resale value, while the costs to maintain are ever increasing. Vehicles that break down frequently, due to age or extensive use, negatively impact service delivery to the public and can pose a safety risk. Transit buses are used for an average usage of 61,000 kilometres annually ranging from 80,000 for newer buses to 30,000 for older buses.
The table below shows the evolution of the bus fleet. There was little active replacement of buses through the 1990’s resulting in a gradually aging fleet. This trend has been reversed recently, particularly with the purchase of articulated buses since 2001. The average age of the fleet is now at an acceptable level, and can be maintained in this status with a regular replacement program.
Figure 12– Conventional Transit Fleet and Usage Data
The City also has 148 auxilliary vehicles in support of transit services with a current replacement value of $9 million and an average age of six years. These vehicles are used for transit related maintenance, supervision and security programs. The vehicles include standard autos, plows, tractors, pick-ups, dump trucks, cube-vans, sweepers, loaders, spreaders and scissor lifts. The replacement funding for these vehicles are included within the heavy vehicle and light vehicle replacement programs. There are possibilities for special funding of transit security vehicles which are being pursued.
All rolling stock used in the provision of the Para Transpo services is owned and maintained by the contractors – First Bus for the main rolling stock fleet. In addition, a contract is also in place with a local taxi company for the provision of additional capacity in the forum of a sedan service. This model of asset ownership by the contractor is expected to continue for the duration of the TAMP.
The O-Train is a diesel light rail system operating on an eight-kilometre line from Greenboro to Bayview transit stations. The City purchased three Bombardier Talent BR463 trains for the amount of $17,669,070. The trains were delivered to the City on 14 May, 2001.
Estimated value as of April 2005 was $10,687,000 based on the buy-back option not exercised by the City. They are currently five years old.
The maintenance facility at Walkley Road is leased from CPR and the trains are maintained by Bombardier under contract to the City.
The railway infrastructure and signals are maintained through a contract with Rail-Term.
The railway will continue to operate as long as possible, but will need to close at some point in 2007 or 2008 to enable work on the North-South LRT to proceed.
Aside from the corridor, which the City owns, the trains are the main capital asset of the O-Train system and these are in the process of having engine and brake upgrades.
The O-Train is a federally regulated railway, governed by the Canadian Transportation Act.
Four city properties are deployed primarily in support of transit services. These are depicted in the following table. Note that the Administration Bldg, North and South Garages are considered one campus:
Figure 13– Transit Buildings and Garages
|
Facility Name |
Year Built |
Building Area (Sq ft.) |
Replacement value |
|
Administration
Bldg – St. Laurent |
1959 |
68680 |
$8,413,300 |
|
Office
and Garage - Pinecrest |
1976 |
134715 |
$27,413,155 |
|
North
Garage and Office - St. Laurent |
1989 |
165846 |
$33,748,003 |
|
Office
and Garage - Merivale |
1978 |
212197 |
$43,179,968 |
|
Office
and Garage- 875 Belfast |
1960 |
45776 |
$9,314,958 |
|
South
Garage - St. Laurent |
1959 |
216614 |
$44,078,783 |
|
Storage Building - Boyd |
1950 |
37342 |
$4,835,789 |
|
Outdoor
Storage Facility – St, Laurent |
2002 |
189814 |
$1,200,000 |
In addition, the following assets are deployed in support of the transit program:
1. 6,268 bus stops
2. 1,117 bus shelters.
3. 5 light rail stations and 42 Transitway stations
In total the real property assets deployed in support of transit services have a square footage of approximately 1.2 million square feet.
Information Technology systems support the provision of transit services in a number of different formats. These range from the basic function of route scheduling across the entire system to a sophisticated service control operations software to individualized travel planning over the web. These systems form the “application landscape” that is depicted in Figure 14. Managing the IT assets is the Information Technology Services Branch which is a Centre of Expertise. The systems are a suite of “Off the Shelf”, developed in-house and Corporate systems that all work together to provide the necessary components of the system.
Figure 14 - Transit Application Landscape
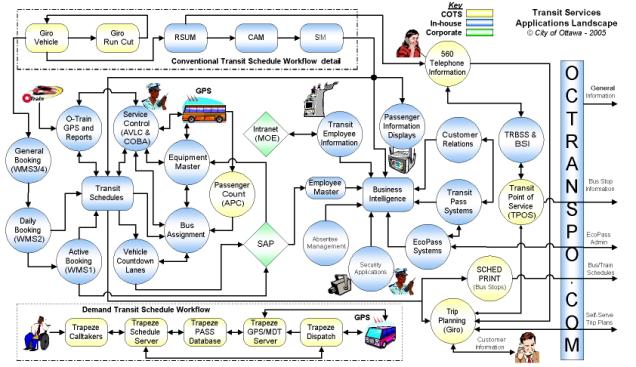
Key elements of the system include:
q Vendor is Giro Inc. (www.giro.ca).
q Used to develop all schedules and operator workshifts for all services, both bus and train.
q CAD/AVL, developed and maintained by City staff
q Used to control on-street service delivery
q Provides data for analysis of service performance
q In-vehicle system vendor is Infodev (www.infodev.ca)
q Equipment installed in 10% of bus fleet and one train.
q Data collection and analysis software vendor is Systemware Innovation (www.swi.com)
q Vendor is Giro Inc. (http://www.giro.ca/).
q Used by internal staff to provide travel/trip information to customers.
q Available to customers on the Internet at octranspo.com for self-service trip planning
q Telephone information system vendor is Telerider (now defunct, but supported by Versyss - www.versyss.com)
q Schedule displays are located at major transit locations
q These schedule displays were developed and are maintained by City staff
q Citrix server using thin clients and LCD panels to display schedule information to transit customers.
OC Transpo uses many applications developed and maintained by City staff in support of core transit business functions. These systems use Oracle Application Server technology, and support the following major business functions:
q Operator work booking
q Operator time reporting
q Customer service
q Administration of multiple transit pass programs
q SAP enterprise system holds vehicle information, time reporting, preventative maintenance schedules, work orders
q Uses SAP Plant Maintenance module
q In-house developed Oracle applications extend SAP functionality.
OC Transpo operates a CCTV system and network comprised of the following major components:
q March Networks Digital Video Recorders (23 locations)
q Pelco cameras (142)
q T1 communication lines
q 2.4 GHz spread spectrum wireless data networks
q Monitoring facility at 1500 St Laurent security control room
Supply Management
uses SAP Materials Management Module to purchase, receive, pay and issue both
Parts and uniform inventories across all locations.
A number of roadways and parking lots are dedicated exclusively to the use of transit vehicles, either on a full-time or part-time basis. The Transitway is a particularly important facility, dedicated to transit use all day. It is complemented by shared use of the Ottawa River Parkway, exclusive bus Transitway and expressway ramps and bus lanes in the downtown that are exclusively used by transit in particular time periods. The table below provides a summary of these facilities.
Figure 15 – Transitway and Road Network Assets
Transit services also use a wide range of roadways in mixed traffic. The use of these roadways is essential to the transit services and although they are not typically considered dedicated “transit” assets, their value to the successful delivery of a sustainable transit service cannot be overlooked in developing a comprehensive best practice transit asset management plan. A preliminary cursory analysis on the basis of lane occupancy would suggest potential attribution of up to 20% of the value of these non-dedicated transit roadways to supporting transit service delivery.
The maintenance programs that are established for assets are integral to ensuring performance and preserving the asset to achieve its full useful life. Following from the baseline inventory of assets that was presented in the previous section, the objective of this discussion is to present the broad maintenance programs that are currently active for key assets under City control: conventional fleet rolling stock, stations/terminals and bus shelters as well as some support infrastructure such as Information Technology and Security assets.
The Light Rail fleet and the Para Transpo fleet are both maintained through service contracts. Therefore, the maintenance programs for these assets will not receive the same level of discussion within this chapter.
q Safety: Follow Transport Canada regulations regarding workplace health and safety regulations and Ministry of Transportation (Highway Traffic Act Regulation 611) regarding maintenance and repair programs.
q Environment: In addition to its own Fleet Emission Reduction Strategy (FERS), the City also tests its buses regularly as required under the Ontario Drive Clean program. It also performs preventative and predictive maintenance inspections that keep buses in good operating condition, thereby reducing emissions.
q Accessibility: Since 1996, the City has been replacing its fleet of high floor buses with low floor units and also provides specialized transit through Para Transpo, a fleet of vehicles that provide door-to-door services for handicapped individuals. At the end of 2005, accessible buses accounted for 56 per cent of the transit fleet
q The Fleet Services Branch has an ongoing Health and Safety program that takes into account all of its garages. The program is coordinated through the City’s Centre of Expertise, Employee Services, and includes a comprehensive committee structure as well as a Policy Committee that oversees the program for Transit Services, Fleet Services, RPAM and Supply- all stakeholders. Statistics are monitored and strategies developed to identify and reduce the number of incidents through training and other prevention methods.
q A comprehensive preventative maintenance (PM) program is in place that focuses on achieving a favourable ratio of preventative to corrective maintenance. The ongoing identification of costly and/or repetitive problems is key to improving PM programs and preventing defects.
q Fleet Services sets an annual goal of providing service to its client, Transit Services, and has increased its daily availability of buses on a daily basis from 85% to 93% in 3 years. The goal for 2006 is 95%.
q ASD - The majority of work is done in house as per the terms of the ATU279 collective agreement, however those terms allow for outsourcing under certain conditions. The City sends out work when its internal resources cannot handle the volume and still preserve its existing maintenance programs. Some refurbishment, warranty work and accident damage is done externally.
q Parts Service is provided by Supply Services, Stores Division, and a proportionately large number of parts are purchased and stored at each garage site or centrally at the City’s main transit garage.
q The Spare Vehicle percentage is currently at 16% of the active bus fleet.
q Fleet Services runs a 24/7 operation at one of its three Transit Garages, three shifts at another (five days a week) and two shifts at the remaining garage.
q Financial Policies: Fleet Services has a life cycle cost reduction program which considers several factors including its maintenance and refurbishment programs, funding from various levels of government, technology, annual condition assessments, the political environment and the age of a bus to determine its replacement time. Some of the above factors could impact the decision to move up the time, extend the life or follow the 18 year guideline now in place.
q Corporate Vehicle and Equipment Idling Policy is part of short-term objectives of the Fleet Emissions Reduction Strategy. Fleet Services developed a new City vehicle and equipment idling policy that was approved by the Senior Management Team. This policy sets limits on idling times, but also provides for exemptions to these limits where needed.
q Predictive Maintenance
Refurbishments throughout the life of a bus are an integral part of the Life Cycle program. The extent to which a unit is refurbished and how often is dependent upon its characteristics as well as the impact that preventative and predictive maintenance programs have had on the unit.
A planned parts replacement program for components and parts that have an historical record of failing at predictable intervals is part of the City’s overall PM program. Parts are replaced in this manner for several major areas such as suspension, electrical and brakes.
q Preventive Maintenance programs can be broken down into four main categories.
Manufacturers’ recommendations
Legislated requirements
Predictive programs based on experience in our environment
Seasonal
q Reactive Maintenance is also known as unplanned work. The ratio of planned to unplanned work is one way of measuring the success of our preventive program. Breakdowns/defects are usually more extensive and expensive in nature and typically cannot be planned. For these reasons it is more advantageous to do preventative/predictive maintenance on a planned basis than to fix as fail. The City’s aim is to reach a 70/30 percentage of planned vs. unplanned labour.
The cost of bus fleet maintenance in 2005 was $47M. These costs were funded 51% by operating revenues and 49% by tax supported revenues.
All rolling stock used in the provision of the Para Transpo services is owned and maintained by the contractors – First Bus. The additional capacity that is provided as part of the contract with the local taxi company Westway is maintained through that firm’s maintenance program. This model of service and maintenance provision will continue throughout the duration of the TAMP.
The maintenance activities for the fleet of three Bombardier Talent train sets are provided through a comprehensive contract for maintenance.
In a similar fashion to other fleet maintenance programs, the auxiliary fleet, which is comprised of tow trucks, mobile service vehicles, delivery vehicles, etc… as well as sedans for security and supervisory operations, is maintained according to Transport Canada regulations regarding workplace health and safety regulations and Ministry of Transportation (Highway Traffic Act) regarding maintenance and repair programs.
These vehicles perform vital operations in support of transit such as winter snow maintenance, retrieving stuck or broken buses, parts delivery, bus stop and shelter maintenance, lighting end electrical maintenance, landscape maintenance and shuttling of bus operators between locations. For the most part the maintenance is performed by internal resources at Fleet operated facilities. Warranty programs are operated for these vehicles and recoveries from manufacturers are processed.
Ensuring the safety and long-term viability of City property assets is the core function of the Real Property Asset Management (RPAM) branch. As the corporate landlord, RPAM is responsible for managing all Transit property including private transit right-of-ways. RPAM provides turnkey property management services. The branch is responsible for setting policies and standards for all corporate landlord activities. Real Property Asset Management Branch, through its Comprehensive Asset Management Division, ensures that buildings are able to provide continuous uninterrupted support to City programming by developing and implementing a specific life cycle renewal plan for each building and building component. These life cycle renewal plans are based on planned uses, strategic asset management reviews, the validated condition of the building, as well as input from the users and operating staff of the facility. From a maintenance and operational standpoint these planning activities are key to asset integrity and attaining the longest useful life from the assets. Operational programs are also in place that try to minimize energy use and environmental mitigation procedures – for example fuel storage and the use of cathodic protection.
Corporate Security also plays a key role in asset management by ensuring that only designated personnel are on the premises and that the workplace is a secure environment.
There is an extensive legislative and regulatory environment in which Property Management must work in order to ensure that City assets are in complying.
q Certificate of Approval – Air under the Environmental Protection Act, Section 9
q Certificate of Approval – storm water discharge under the Ontario Water Resources Act
q Regulation 127 reporting under the Environmental Protection Act
q Hazardous Waste Information Network (HWIN) registration, fees, and reporting under Ontario Regulation 347 (section 18)
q Annual Tank Testing as per the TSSA, LFHC
q Interceptor Maintenance under Ontario Regulation 525/98 under Section 53 or the Ontario Water Resources Act
q Annual Interceptor Inspections as per Procedure for the Handling and Disposal of Selected Wastes from Motor Vehicle Servicing Facilities, prepared by the Ministry of Environment, Municipal Sanitary Sewer-Use By-Law, Ontario Building Code - Part 7 Plumbing
q Discharge Permits/Effluent Monitoring under the Municipal Sanitary Sewer-Use By-Law for the following locations: St. Laurent, 805 Belfast, Merivale, Pinecrest, Remediation System, St. Laurent South Garage, Lee's Avenue, Quarterly at Walkley Yard
q Asbestos surveys, updates and removal work under the Labour Code and Ontario Regulation 347
There are a number of legislative inspection and maintenance items: hoists; elevators; BFPR (Back Flow Preventors); HVAC Systems – AHU’s, Boilers, Exhaust Fans etc…; fire suppression systems – sprinklers, panels, hydrants; emergency eye and body showers; personnel harness and life lines; electrical panels/disconnects; emergency power generators; methane sensors.
The following are a number of specific priorities that will be implemented through RPAM as part of the comprehensive asset management strategy:
q Provide fall restraint devices at all garages where required
q Improve lighting and ventilation at countdown operation areas
q Provide training for hazard awareness
q Implementation of Preventative Maintenance to improve efficiencies.
Overall maintenance activities are guided by the following policies:
q Maintain facilities to provide a safe and hazard free environment
q When the nature of the work is beyond the abilities of internal forces, alternate service will be arranged
q Environmental polices follow from the regulatory and legislated requirements such as spill procedure, procedures for interceptor dipping and maintenance etc.
q City of Ottawa Accessibility Policy/Design Guidelines
The maintenance program is comprised of the inspections and monitoring that is required to comply with all applicable legislation and regulations as well as the preventative measures that are taken to ensure the useful life of the assets.
q Implementing barrier-free design features into Transit facilities will impact the cost of new construction
q Environmental approvals require considerable funds to meet the legislated requirements
q Accessible air conditioned buses require additional equipment for servicing
Transit services also use a wide range of roadways assets whether dedicated to transit or in combination with mixed use traffic. The use of these roadways is essential to the transit services.
In addition to the annual capital renewal dedicated to Transitway networks, approximately one-half of the annual rehabilitation capital directed toward non-dedicated transit assets is allocated to arterial and collector roadways that are also integral to the transit systems. The impact of transit use on roadway and structure performance translates into heavier construction considerations, shortened life expectancies and more frequent and aggressive maintenance interventions.
o Canadian Highway Bridge Design Code CAN/CSA-S6-00
o Federal and Provincial Environmental Assessment
o Occupational Health and Safety Act and Regulations Requirements
o MTO Standards and Manuals
a. Ontario Structural Inspection Manual
b. Structural and Rehabilitation Manual
c. Drainage and Hydraulics
d. Roadside Safety
e. Geometric Design Guidelines
f. Ontario Provincial Standards
g. Heritage
o Other Canadian, US and OECD practices
Rehabilitation budget targets are considered at a program level based on life cycle models that consider, in varying degrees of accuracy:
· classification of like asset elements into classes ( material, type, size, environment …)
· theoretical service life expectations by class
· replacement values by class
· age and remaining useful life estimates (based on age) by class
· deterioration curves
Requirements for the linear network as a whole are established through use of the same condition assessment tools used for needs identification (Pavement Management System, Infrastructure Management System, Bridge Management Systems etc.). The life cycle needs are supplemented with additional modeling, studies and depreciation/deterioration analysis to validate anticipated network performance over the extent of the asset life and their associated re-investment requirements. The results of these analysis support the bulk level program based rehabilitation budget requests, long-range financial planning exercises and rate review exercises.
All individual linear asset elements or components have some form of defect or deficiency. The presence of defects or deficiencies does not translate into an immediate requirement for action. The City’s condition assessment process is one of monitoring and assessment that allows prioritization or ranking of the severity and extent of defects and deficiencies according to condition assessment criteria.
Multiple combinations and permutations of these deficiencies results in the establishment of a Performance Condition Indicator that allows for individual element or asset component to be defined as “in need” against defined performance expectations (Level of Service Indicators) for specific asset classes (ex. pavement, wastewater collection, water distribution …). The current processes are structured to ensure needs within the asset class are established relative to an objective hierarchal structure that essentially means:
· the element or component does not meet mandated or legislated requirements
· the element or component does not meet the established level of service expectation ( ex. min acceptable PQI, HPI, SCI …)
· the element or component is part of a subset that have optimal cost to benefit opportunities against their lifecycle renewal requirements
· the element or component requires attention due to influencing factors other than:
o health / safety / environmental
o Level of service or service delivery needs
Generally needs are sections that:
· Exhibit imminent structural failure that would compromise service
· Present an health and safety issue
· Do not meet service level expectations
· Present opportunities to support broader environmental or growth objectives
Only the subset of the network that is defined as “in need” is considered for project candidature.
Project definition is a decision making process that requires the consideration of multiple influences, priorities and opportunities that is more complex than a linear assessment of the prioritized “needs” ranking. The City’s practices enhance the needs ranking for the asset class through consideration of coordination opportunities for work on multiple asset classes, maintenance reduction opportunities and external influences or opportunities. The current decision based approach is an integration and consideration of multiple factors such as:
Once project candidature listings are established, they are maintained and updated as part of a cyclical programming exercise that considers capital budget allocations; market costs pressures and changing needs and environments.
Condition Assessment of Roadways
All roadway performance is managed through a pavement management system that performs analyses at a network level. Utilizing information from the entire network of roads, an array of rehabilitation strategies, predictive modeling and performance monitoring as well as associated intervention costs versus gains, a network level analysis is carried out to predict the timeframe and optimum requirements to maintain the network at a sustainable level and prioritize candidate projects for detailed programming analysis. The use of the PMA provides an objective, consistent and repeatable approach to identifying network improvement needs based on a technical analysis of the available data.
The measure used for the analysis of pavement condition is the Pavement Quality Index (low to high range of 0-10) that is a function of the following indices:
· Ride Condition Index (RCI, 0-10 range): International Roughness Index (IRI) measurements are taken using specially equipped vehicles, which in turn is converted to the RCI.
· Surface Distress Index (SDI, 0-10 range): a measured rating of surface defects made on a specified increment, usually at 30 m intervals on each section of road.
· Structural Adequacy Index (SAI, 0-10 range): a measured strength based on deflection testing.
Field data is collected on a cyclical basis and input into the PMA. Roads are considered to be a "Now Need" once their PQI value falls below the minimum desirable level. Where the pavement condition survey data for a particular road exceeds the desirable PQI, the PMA will identify the year of need based on the predicted rate of deterioration using the performance curves. When the condition has fallen below the desired minimum PQI value, the selection of an appropriate rehabilitation strategy is made.
In addition to standard treatments, the City experiments with various alternative technologies such as Cold-in-Place (CIP) recycling, Foamed Asphalt, Base Stabilization, and Micro Surfacing treatments. The City has also experimented with Ultra-thin White topping (UTW, concrete over asphalt), high performance asphalt mixes, and full depth concrete pavements at Transitway stations.
Condition Assessment of Structures
The safety and reliable serviceability of the structural infrastructure within the right of way of the roadway and transit network is critical in terms of network continuity and continued economic viability of the community. Efficient management of the system is essential to keep the life cycle costs of the structural assets to a minimum, to ensure user and worker safety and to avoid any unpleasant surprises in terms of intended function of the facilities and costs.
The inventory includes structures within the Road and Transit right of ways and excludes any independent stairs or structures within parks owned and maintained by the City. This inventory does not include structures on the Provincial Highway, Federal Parkways or CNR/CPR Railway Bridges unless there is a shared responsibility. Bridges across the Ottawa River are Inter-Provincial Bridges and are the responsibility of NCC or PWGSC. A computerized Structural Inventory Management System (SIMS) is utilized to record basic information and other data with respect to structures.
Inspection and condition assessment protocols for structures as base don th ePublic Transportation and Highway Improvement Act that states : “The structural condition, safety and condition of every bridge shall be determined through the performance of at least one inspection every two years under the direction of a professional engineer and in accordance with the Ontario Structure Inspection Manual” The process is based on detailed inspections with varying levels of details and frequency, as follows:
· Routine Bridge Inspection (RBI)
· Monitoring Inspection (MI)
·
Condition
Inspection (CI)
· Unscheduled Inspection (USI)
· Guaranteed Maintenance Inspection (GMI)
A. Structure has identified critical needs - inspected a minimum of four times per year.
B. Structure is inspected twice per year, once in the winter and summer.
C. Structure is inspected once per year.
D. Structure is inspected once every two years
E. All other structures known to be in good condition and are inspected at intervals exceeding two years
The deficiencies are assessed and are categorized in terms of urgency for remedial action for the overall structure and categorized as either, Now, 1-5 years, or 5-10 years priorities.
Routine maintenance operations and simple repairs are generally undertaken by the Bridge Maintenance crews in Surface Operations Branch on a work order basis, with Structures & Transit Division staff providing necessary guidance and advise. Surface Operations Branch may contract out some operations. These routine operations include:
· Pressure washing of all major structures in spring to remove salt accumulation.
· Replacing/repairing expansion joint seals.
· Miscellaneous asphalt repairs including minor replacement to waterproofing membrane.
· Guiderail repairs and replacement.
· Deck drain repairs.
· Minor concrete patching and repairs.
· Handrail and barrier repairs.
All other repair, rehabilitation and replacement activities are undertaken as defined projects upon availability of funding. Depending on the size and scope of the Project, it may take number of years from initial implementation stage to completion and delivery of the Project.
Inventory levels are maintained in an Enterprise Resource Planning (ERP) system, which controls physical location, costs and quantity of materials on hand. Transactional information is recorded for all purchase receipts and issued against Work orders or Cost centers. This forms the basis for forecasting future requirements and identifying trends and other areas of concern.
Inventory operations are carried out using a central location and satellite operations to support maintenance at the various garages. Each item in inventory is assigned various control characteristics consistent with past history and future requirements. Each garage storeroom operates on a cycle count process designed to verify all inventory in those locations during the calendar year. All items in inventory are reviewed yearly to identify obsolescent parts of quantities inconsistent with actual demand. Disposals are carried out using Requests for Bids
The financial strength, quality, warranty policies and physical location of Bus manufacturers and the major sub system suppliers strongly dictate the levels of inventory carried. Both the City and the Supplier respond to the costs of carrying inventory but then diverge to meet separate needs. For the City of Ottawa there is a need to keep the buses in service to meet ridership needs. This requires a part to be on the shelf before you use it and to maintain this level for a substantial period of time usually beyond that which is required of other automotive sectors.
The Tendering system needs to improve parts supply by connecting availability and price to the procurement of new buses. Enforceable parts commitments dealing with price and stocking levels must be put in place that are mindful of the commercial pressure to cut costs and inventory sizes in an already weak bus manufacturing sector.
Access to Manufacturers Part numbers is required from all Bus suppliers as part of new bus purchases to allow sourcing of parts where the Bus supplier doesn’t carry sufficient stock or where optimum market pricing is sought for common parts used in other bus designs and represented under different bus supplier in-house part numbers.
Warranty Repair
Warranty repair service when carried out by OEM suppliers is to slow to support Fleet serviceability levels. Ramping up to repair a fleet wide problem is not economical for their recognized service centers as excess capacity occurs immediately when the warranty period is over or a design change has fixed a latent defect. Tenders should include warranty associated down time limit to protect against these occurrences.
Some warranty work is carried out in what could be classed as an R&D environment on the newer buses. Necessary repairs cause capacity constraints on planning, administration and storage capacities. Administration costs should be incorporated into Tenders to cover design problems.
Multiple bus types, changing sub systems and small production buys are increasing inventories levels and will present future problems as the fleets age and fewer and fewer support parts are carried by the suppliers to supply them.
Within the Conventional Fleet the Fleet Services Branch works in a culture of Continuous Improvement. Management supports an environment that will encourage, promote, formalize, recognize, and enhance the Continuous Improvement culture that already exists in Fleet. Here are some of the initial areas we are concentrating on:
q a way for everyone to have an opportunity to voice their ideas
q a conduit that will ensure ideas get elevated to the appropriate level
q a mechanism to fairly and quickly evaluate the ideas
q a means to communicate the results of the evaluation back to it's originator
q a method for recognizing ideas that get implemented
q a means to continuously energize the Continuous Improvement processes
In addition RPAM has undertaken a number of initiatives to reduce costs and to streamline management practices. It will also launch a Branch wide re-engineering initiative within the coming months that will have as its sole purpose more efficient and effective service delivery. Infrastructure Servicves is also conducting a competitive service delivery review to find ways to improve the efficiency and effectiveness of service delivery.
Below is a review of the Fleet Services 2005 Continuous Improvement accomplishments:
In order for a business to improve itself, it must be able to measure its effectiveness. In 2005 Fleet Services laid the foundation for being able to monitor its own performance against like cities. We participated in the Ontario Municipal CAO's Benchmarking Initiative (OMBI), which represents cities across Ontario. In addition, Fleet Services lead the creation of benchmarking for the Canadian Association of Municipal Fleet Managers (CAMFM), which represents cities across Canada. With respect to OMBI, we actively participated in the review of their fleet performance measures. By inserting ourselves directly into both the provincial and national benchmarking associations, we're helping to ensure these performance measures are useful, accurate, comparable (as apples to apples as possible), and measurable.
A committee of dedicated Fleet and Finance staff worked with a consultant to review how Transit Fleet Maintenance performed warranty work. The goal was to ensure Fleet was performing to industry best-practices. The report concluded very favourably, citing the fact that Fleet Services is already recovering over 90% of what it should be.
A few small but significant steps were taken to help make finding and ordering parts easier. This gave Fleet, Finance, and IT a better understanding of the issues and challenges of moving to an electronically based parts catalogue. More work in 2006 is planned to move this opportunity forward.
The Service One Program was launched which, when comparing 2005 to 2004, has resulted in an overall reduction in bus changes by 38% and bus defects by 17%. In addition, the foundations were put in place to begin bar-coding labour in early 2006.
The Capital Program as it is depicted in the 2006 Draft Capital Budget contains 41 projects (as illustrated in Appendix A of this document). These projects have a combined value of $2,480,500,000 and cover a ten-year planning horizon. The Draft Budget includes extensive work for the North/South Light Rail Corridor and the East/West Light Rail Corridor with $1,418,325,000 in planning spending over 10 years.
This section deals with the proposed purchase of buses over the planning period.
The key priorities to improve our bus acquisition program are:
q Meet the needs and priorities of Transit Services as directed by Council.
q Assess technological improvements, regulatory requirements and Transit Services’ needs to develop cost-effective vehicle acquisition plans and support programs.
q Develop acquisition strategies (standardize) and optimize the replacement cycle to ensure best value to taxpayers
q Develop new vehicle specifications based on industry best practices and sound technical solutions
q Ensure vehicle safety through monitoring adherence to standards and perform safety investigations including plans for corrective action
q Develop in-service modifications and product improvements to vehicles to increase performance and reduce costs
q Dispose of surplus vehicles for maximum financial benefit
q Coordinate initiatives to reduce emissions, such as the Fleet Emission Reduction Strategy (FERS), and the environmental impact of transit vehicles.
The City’s Accessibility Policy is to acquire only low-floor, accessible buses to accommodate people with disabilities.
New transit buses are acquired through multi-year contracts as the result of a detailed competitive bid process to identify the best value bus for Ottawa.
The delivery of the New Flyer Invero bus continued as planned in 2005 to meet 2004 Budget allocations and a purchase order was submitted to meet the 2005 budget commitments totalling 130 buses. The first order of buses was used to make appropriate configuration changes to the bus.
With recent bus acquisition focused on articulated buses, future acquisitions will focus on the standard bus fleet. Future bus requirements based on current plans are shown in the table below.
Figure 16 – Capital Programs for Conventional Active Fleet
|
Replacement /
Ridership Growth |
Budget Year |
Total |
|||
|
2006 |
2007 |
2008 |
2009-15 |
||
|
Bus Refurbishment |
31 |
32 |
0 |
430 |
493 |
|
Vehicles: Standard Equivalent Buses |
63 |
80 |
12 |
271 |
426 |
|
Replacement |
36 |
48 |
12 |
80 |
176 |
|
Growth |
27 |
32 |
0 |
191 |
250 |
|
Facilities - Transit Garage |
- |
- |
1 |
1 |
2 |
The acquisition program will result in total bus inventories as follows:
Figure 17 – Conventional Active Fleet Evolution over TAMP Timeframe
|
2005 |
2006 |
2007 |
2008 |
2009-15 |
|
|
40' Standard |
683 |
714 |
741 |
773 |
964 |
|
60' Articulated |
227 |
227 |
227 |
227 |
227 |
|
Mini Bus |
1 |
1 |
1 |
1 |
1 |
|
Active Buses |
911 |
942 |
969 |
1,001 |
1,192 |
|
Standard Equivalents
(SE) |
1,025 |
1,055 |
1,082 |
1,114 |
1,305 |
|
- Annual SE Growth
% |
|
3.0% |
2.6% |
3.0% |
2.5% |
The 2004 approved Fleet Emission Reduction Strategy directed Fleet Services to pursue in 2005 the hybrid bus acquisition project, participate in catalytic conversion programs and develop a business case for bio-diesel. Working through CUTA and with Environment Canada, 25 diesel oxidization catalytic converters were installed on the 1991 MCI bus fleet with impact on fuel consumption of about a 3.5% decrease compared to 2004. Working with Natural Resources Canada, the business case for the use of bio-diesel was drafted by a consultant by end of the year, which will provide direction with respect to bio-diesel fuel implementation.
Fleet Services took part in the Earth Day 2005 (April 23) activities with a diesel-electric bus and the Hybrid Feasibility Study contractor, the National Research Council of Canada, set up a booth.
The 2004 Budget authorized Fleet Services to initiate Phase 1, the Feasibility Study, of the Hybrid Bus Implementation Project. At the start of 2005, winter trials of two major hybrid system suppliers were well underway. The National Research Council of Canada, hired to conduct the evaluation and testing, submitted its final report in August. A report to Transportation Committee and Council was presented in November recommending proceeding with implementation based on the positive results obtained. Sponsorship from the Federation of Canadian Municipalities covered 50% for the cost of the study was confirmed. The project was within budget and on target.
In 2005 an unsolicited proposal was received to purchase compressed natural gas (CNG) buses in lieu of diesel-electric hybrid buses. The proposal claims that a CNG fleet would produce savings when compared to a hybrid fleet. Fleet Services conducted a thorough assessment of the proposal and found that CNG buses would cost significantly more than hybrids. When the CNG option was briefed at Committee in November, Fleet Services was directed to obtain an independent third party evaluation of the CNG bus option. This has been initiated.
A new fleet of accessible transit vehicles for Para Transpo service will be required at completion of the current contract. It is currently anticipated that the service will be contracted and the next contract will include a requirement that the provider acquire and maintain the required vehicles.
The North-South LRT project will run from Mackenzie King Bridge in downtown Ottawa to Woodroffe Avenue in Nepean. It will be a 27 km system of dual-track operated by low-floor electric trains.
The system is currently being procured as a Design, Build and Maintain project. The successful consortium will be responsible for the maintenance of the infrastructure, systems and trains for 15 years following start-up, which is planned for the end of 2009. The LRT system will be operated by the City.
The possible extension of the North-South LRT from Mackenzie King Bridge to Ottawa University is under discussion. If negotiations are successfully completed, this would be built as part of the initial project.
An Environmental Assessment is underway for an East-West LRT but the corridor has not yet been defined.
The auxiliary transit fleet performs vital operations in support of transit. Charges for vehicle depreciation are included in the charges to departments, and the resulting funds are placed in the fleet replacement reserve account. These funds are then employed to replace individual vehicles as required. Currently replacement requirements are included in the general municipal fleet requirements. . It is imperative that incremental operating budget impacts arising from increased costs of replacement, or growth in the size of fleet, are fully disclosed and included in the annual operating estimates approved by City Council, whether or not these costs qualify for senior level government funding.
The bus control centre is outgrowing its current accommodation. It is planned to move this in 2007, together with the transit security control facility and transit control centre to 875 Belfast. The North-South LRT control centre will also be located at 875 Belfast, to provide a fully integrated transit control centre.
Two new bus maintenance garages will be required over the life of the plan to accommodate the maintenance requirements of the expanding fleet. Design of the first facility will be completed this year and construction is planned for 2007-8. The second facility will be required towards the end of the planning period. Regular life-cycle maintenance and improvements will continue in the existing facilities, as well as at the various Transitway stations and other transit real property assets.
The key programs for new system development in coming years relate to the extension of the SmartBus program into Phase 3.
The City will be introducing a proximity-based smartcard fare collection system in time for the expansion of light rail service in the fall of 2009. The introduction of a proximity-based smartcard fare collection system will also apply to OC Transpo’s 900+ bus operation.
The system will make use of contactless smartcards and readers. Customers will be able to configure their cards as any one of a number of possible period passes (Ecopass, annual, monthly, semester for students etc) that will allow unlimited use during the period paid for. As well, customers will be able to ‘load’ the card with money and have the fare for a trip deducted from the card. Customers who do not have a smartcard will be able to pay their fare with cash on all buses or purchase a ticket from vending machines at all light rail platforms and at some major Transitway stations. The light rail vehicles will not have any fare equipment on board, including fireboxes or smartcard readers.
The smartcard system will allow seamless travel between bus and light rail services as well as seamless travel for customers transferring between OC Transpo and Societé de Transport de l’Outaouais (STO) transit systems. STO already operates with a smartcard fare payment system. The compatibility of the OC Transpo and STO systems is a strong requirement, with STO in full support of this initiative.
The system will take advantage of the SmartBus GPS-based system now being installed on all buses. The on-bus mobile data terminal will also serve as the operator interface for the smartcard system. Readers will be installed at the front doors on all buses. The current Proof of Payment (POP) system now in force on all articulated buses and the O-Train will remain. Customers who have a smartcard configured as a valid period pass can board through the rear doors of articulated buses. The future LRT system will also be a POP system. There will be no readers on the trainsets themselves but readers will be strategically located on all station platforms to allow customers to pay their fare with the stored value portion of the card. Transit Fare Enforcement Officers will continue to be used to ensure the integrity of the fare system by randomly checking passengers on articulated buses and the new LRT system to make sure customers have proof that they have paid a fare.
IBI Group was retained in February 2006 to develop the terms of reference and to assess and document the impact on internal support systems. Once done, a Request for Proposal will be issued in August 2006 with contract award for the system slated for November 2006. The implementation timetable for the system will see the introduction of smartcards configurable as any form of prepaid pass (monthly, annual, Ecopass etc) in late 2007 followed by the implementation of the ‘purse’ or stored value feature in late 2008.
It is expected that approximately 1100 smartcard readers will be purchased to equip the bus fleet and maintain operations through to the year 2010
The current system is made up of 90 APC equipped buses. There are no spare APC units but a small stock of key replacement components is maintained. As problems arise, components are swapped and the defective ones are repaired. There are plans over the next 3 years to replace the older 45 APC units with newer GPS based equipment. The cost of this is estimated to be $75,000 per year. As the bus fleet grows, the 10% ratio will be maintained. The budget figure above takes this into account.
Currently, one of three O-Train trains is equipped with APC equipment. The new Light Rail tender that is now on the street requires five of the approximately 20 trains to be equipped for passenger counting. The initial cost and ongoing maintenance for 15 years will be included in the final LRT contract price.
Other requirements related to the SmartBus and related communications and information systems include:
q SmartBus Phase 3
Transit Priority ($1M)
Vehicle Diagnostics ($500k)
CCTV ($ 4M)
In-vehicle announcements ($1.5M)
q Replacement of UHF radio system ($ 12M - start 2010)
q Hastus version upgrades ($300k - every two years starting 2006)
q Install bus arrival signs in downtown core to speed passenger loading/unloading and integrate with LRT ($600k – start 2007).
q Integrate bus passenger information system with LRT ($300k start 2008)
q Para Transpo lifecycle
EDACS radio - $525k
Infrastructure desktops servers printers $550k
q Scheduling system lifecycle - $1.55m (Replace in 2012)
In order of priority, the following transit stations need to be fitted with CCTV technology:
|
1. Bayshore |
$ 60,000 |
|
2. Trim |
$ 30,000 |
|
3. Tunney’s |
$ 60,000 |
|
4. Westboro |
$ 60,000 |
|
5. Campus |
$ 40,000 |
|
6. Lees |
$ 60,000 |
|
7. Lebreton |
$ 40,000 |
Once these items are completed, the following transit stations will have to be evaluated for CCTV installation: Smyth, Cyrville, Lycee Claudel, Queensway, Riverside, Pleasant Park and Iris. Equipping these stations with CCTV technology is less crucial as they are smaller in size and are not considered major transfer points. Costs listed are based upon discussion with IT and previous installations.
Given the current climate regarding threats of terrorism, it is also recommended that the following transit stations, listed in order of priority, be equipped with PA systems:
1. Bayshore |
$ 10,000 |
|
2. St.Laurent |
$ 10,000 |
|
3. South Keys |
$ 10,000 |
|
4. Bayview Rail |
$ 10,000 |
|
5. Bayview |
$ 10,000 |
|
6. Billings |
$ 10,000 |
|
7. Greenboro Rail |
$ 10,000 |
|
8. Greenboro |
$ 10,000 |
|
9. Hurdman |
$ 10,000 |
|
10. Baseline |
$ 10,000 |
Transit service uses a wide range of dedicated and shared mode roadway assets. The use, maintenance, rehabilitation and reconstruction of these roadways is essential to the transit service.
Funding requirements for the maintenance and rehabilitation of existing Transitway and road network components are also identified, along with the requirements for extensions or improvements in these facilities.
In addition to repair, rehabilitation and renewal requirements to sustain these assets, there capital investments specifically aimed at operational improvements and network expansions. For example, one key expansion project is the link between Pinecrest and Bayshore on the western Transitway, which will fill a major missing link in the existing system and significantly improve travel times for bus users to and from the Kanata area. Similarly the completion of the south-west Transitway to Barrhaven will be required over the planning period.
In addition to the information on the Capital Plan
that has been discussed in this Section there is further detail contained in
Appendix A which includes excerpts of the relevant projects that were part of
the 2006 Capital Budget for the City.
The Financial Program is based on the 2006 Capital Budget
approved by Council and the related 10 year forecast. The annual budget process will remain the City's principal forum
for deciding how to spend available capital and operating funds. This process must consider not only the
availability of the required capital funding, but also the funding required to
operate and maintain the assets concerned.
The City has a Long Range Financial Plan to forecast the timing of key
expenditures over the next ten years and the need to allocate/generate funds
for these initiatives. This plan
serves as the basis of the annual capital budgeting process. The Transit Financial Program is
summarized in the table below. It
outlines the total of the forecast expenditure authority and outlines how the
expenditures are projected to be financed.
Figure 18 – Transit Financial Program Projected in 2006 - 2015
|
Future Public Transit Costs included in the 2006 Capital Budget |
|||||
|
(2006 - 2015, $ millions) |
|||||
|
Cost Area |
2006 |
2007 |
2008 |
2009-15 |
TOTAL |
|
Light Rail |
730 |
|
|
689 |
1,419 |
|
Transitway |
16 |
53 |
19 |
319 |
407 |
|
Buses - refurbishment, replacement, growth |
37 |
71 |
12 |
280 |
400 |
|
Facilities & Equipment |
14 |
59 |
5 |
121 |
199 |
|
Systems |
3 |
13 |
7 |
13 |
36 |
|
Park & Ride Lots |
|
|
7 |
13 |
20 |
|
Total
Capital Costs |
800 |
196 |
50 |
1,435 |
2,481 |
|
|
|
|
|
|
|
|
Funding Sources |
2006 |
2007 |
2008 |
2009-15 |
TOTAL |
|
Federal Contributions |
233 |
40 |
10 |
472 |
755 |
|
Provincial Revenue (other than gas tax funding) |
212 |
34 |
5 |
420 |
671 |
|
Debenture Proceeds |
215 |
43 |
8 |
356 |
622 |
|
Development Charges |
116 |
23 |
8 |
145 |
292 |
|
Provincial Gas Tax (Gross) |
30 |
37 |
37 |
259 |
363 |
|
Provincial Gas Tax Allocated to Operating Costs |
(7) |
(10) |
(37) |
(224) |
(278) |
|
Tax Supported Reserves |
1 |
10 |
19 |
7 |
37 |
|
Other Unspecified Revenue (1) |
|
18 |
|
|
18 |
|
Total
Funding Sources |
800 |
196 |
50 |
1,435 |
2,481 |
Note 1: The other revenue requirement refers only to
the West Transitway project. Staff is
pursuing senior level funding, that at the time of this report is not
confirmed.
Provincial gas tax is presented as projected annual gross
receipts, less the portion allocated to fund eligible operating budget
expenditures, including debt-servicing costs.
As first documented in the Long Range Financial Plan, the majority of
Provincial gas tax receipts in the outer years are projected to go towards debt
servicing.
While the provincial gas tax revenues are separately identified,
the other major contributions from the federal and provincial government are
the $400 million committed towards the current LRT project, and the expectation
of a comparable commitment to the east-west LRT line. The usual one-third
provincial subsidy for the replacement and purchase of new buses has also been
included.
Development Charges are fees
paid to the City by developers based on the building permits they take out, and
are used to fund the City infrastructure that supports that new growth. Of the $292 million in Development Charges
included in the 2006 Draft Capital Budget, the LRT project is allocated $109 million
in funding. The funds the city will
borrow as debentures and contribute from current tax revenues are also
identified in the table.
The current Long Rang Financial Plan (LRFP2) called for an expenditure level beyond current resources. The LRFP2 will be refreshed before mid-year 2006, which is likely to lead to some changes in the plan for the latter years of the planning period. These changes will be reflected in the next TAMP.
Risk Management forms a key part of any strategy to manage assets and delivery service. There are a multitude of obstacles and events that could impede the ability of an organization to delivery service and meet its objectives. While some extreme perils are mitigated through the use of appropriate insurance policies and risk awareness most are managed on a daily basis through the use of good management practices and strategic planning. For instance – a risk to meeting service delivery could be an increase in the breakdowns of an aging fleet. This risk is mitigated through the appropriate acquisition of new vehicles as well as refurbishment and retirement of existing rolling stock. So, these items may be addressed in the current Fleet Renewal Strategy.
The Table below outlines at a high level some of the risks that have been identified for service delivery and asset management as well as the potential risk mitigation measures and benefits.
Figure 19 – Table of Risks and Mitigation Measures

Funding issues encountered with new Bus acquisitions delay or result in an aged fleet. Parts become more and more difficult to find. When found are found they are kept in quantities consistent more with their rarity than against possible usage forecasts. Obsolescent costs increase accordingly. The ability to maintain a regular bus replacement program is the best way to minimize this risk.
The City carries insurance to protect its investment in vehicles, real property and other assets for loss or damage to property from any cause including flood and earthquake. The insurance provides coverage for:
Replacement value and/or reproduction values as indicated on a schedule of buildings, contents including works of art and artefacts, and miscellaneous equipment and vehicles. The City is to furnish a new Statement of Values annually, and, based on such Statement of Values, agrees to revision by endorsement of the amount of insurance required to be maintained.
q Property of others under control of the City
q Transit Coverage at any location
q Professional Fees - Limit $100,000
q Replacement Cost on assets unless specifically limited or excluded.
Replacement Cost on same site not required but settlement cost shall be based
on replacing property on the same site
q Property newly acquired to be automatically covered. It shall be a condition of the insurance
than any changes that may take place will not affect or require any adjustment
in the premium during the term of the policy provided that the total
replacement cost value of the property insured does not fluctuate by more than
25%
q Broad Form Coverage including sewer back-up, earthquake and flood
q Property of every description
q OEF No. 99 Excluding Long Term Vehicles Endorsement to be included
q Permission is granted to make additions, alterations and repairs,
for property to remain vacant, for unrestricted use of the property and to keep
and use such materials as are usual to the Insured's business
q Property newly acquired to be automatically covered
q No Co-Insurance or Stated Amount Co-Insurance Clause.
q Earthquake: Insurance to be
extended to include loss or damage caused by the perils of earthquake.
Policy Limits
Replacement value of buildings, contents and miscellaneous equipment as per schedule provided by the Insured annually. Reporting of new/renovated/demolished/sold properties changes made throughout the policy term will be reported by the Insured when such changes are in excess of $1,000,000.
TOTAL BLANKET LIMIT - $2,500,000,000 Buildings - $ 1,900,000,000, Contents and Other Assets- $ 900,000,000, (*Includes Motor Vehicle Fleet valued at $663,093,900)
Labour Force Risk
Retirement and adequate Recruitment
Transit Fleet Maintenance is having difficulty in recruiting 310T technicians. It has started an internal apprenticeship program and is pursuing partnerships for alternative technical recruitment such as with educational institutions..
The City of Ottawa has an extensive inventory of transit related statistics and performance metrics. It contributes to CUTA, APTA, OMBI and the Provincial MPMP benchmarking and transit information initiatives. The City is also developing its own performance measurement methodology and indicators that will encompass all aspects of City services including transit provision and support.
The Ridership Growth Plan contains a comprehensive set of performance indicators that are not repeated here. However, some performance measures are presented as a baseline for measurement of the objectives that are set out in this asset management plan. Over the course of the plan new measures may be developed or included. The following measures show the magnitude of the system and the high level of efficiency in which it is operated.
Each weekday Fleet Services is required to provide a certain number of buses in order to meet rush-hour requirements. This measure reflects Fleet’s ability to provide the required number of buses daily. Performance has been increasing consistently. Figure 20 – Selected Performance Measures includes the percentage of days all required service vehicles available measure.
Percentage of Planned Service Trips Operated
This measure reports on the proportion of all planned scheduled trips that were operated. It is an indication of how well the fleet and operator resources are used to cover the planned service.
The number of bus changes represents the number of times that a bus broke down while doing its routes and therefore had to be replaced by another functioning bus. Chances of bus breakdowns are increased by increased usage, age, as well as other factors. Therefore the appropriate performance measure should be distance traveled per bus change. This indicator shows that performance has increased by 6.9% from 2002 to 2004 and each year has shown an improvement over the prior year.
Figure 20 – Selected Performance Measures
|
Year |
KMs |
KM/Bus |
% Days Transit Bus Requirements Met |
% of
Planned Trips Operated |
Kilometres
Driven per Bus Change |
|
2001 |
52,453 |
58,411 |
75.3% |
N/A |
5,659 |
|
2002 |
53,030 |
58,083 |
85.2% |
99.4% |
6,340 |
|
2003 |
55,330 |
59,881 |
86.4% |
99.2% |
6,763 |
|
2004 |
55,625 |
63,067 |
93.3% |
99.4% |
6,778 |
|
2005 |
55,254 |
60,652 |
95.4% |
99.4% |
6,878 |
2004 was the first year the City of Ottawa formally participated in this benchmarking exercise. Fleet Services’ participated by providing the “Fleet and Management services” portion of the 2004 OMBI performance indicators. The Transit result relevant to asset management is as follows:
Figure 21 – OMBI Indicators
|
|
Ottawa |
OMBI Average |
|
Efficiency Indicator: |
|
|
|
Cost per
kilometre - Transit Coaches |
$1.25 |
$1.21 |
The comparison of the above OMBI measure between Ottawa and the OMBI average has to be done taking into consideration various factors, which can influence the amounts presented above. These factors include: fleet mix, fleet usage, cost basis, internal chargebacks, and organizational structure. The following is a discussion of how these factors can affect this particular indicator.
q Fleet Mix – The composition of the transit fleet between standard and articulated buses will affect the costs. The average age of each municipality’s fleet will affect the amount required to be spent on repairs.
q Fleet Usage: The routes assigned to buses will affect costs (i.e. downtown corridor vs. Transitway service). The operating environment in which the vehicles are being used will also influence costs and need for service.
q Cost Basis – Although the CUTA definitions for cost should be used, there may be minor differences between the way municipalities capture costs.
q Internal Chargebacks: (i.e. building rents, parts department, etc.) Some municipalities get chargeback for everthing and others do not get charged back for such items as facilities, purchasing, information systems, human resources, etc.)
q Organizational Form: The extent to which organizational form influences results will vary by municipality, but data collection instructions need to be refined to account for centralized vs. decentralized fleet services.
Spare Bus Ratio
– as an indication of the reliability
of the fleet the amount of service capacity (spare vehicles) that staff feel is
necessary in order to ensure that the fleet has the potential to meet service
expectations. The table below shows a
declining trend in the Spare Fleet or Spare Ratio.
Figure 22 – Conventional Active Fleet Spare Ratio
|
Year |
Active
Buses |
Peak
Service |
Average Age |
Average
Retirement Age |
Accessibility |
Spare Bus Ratio |
||
|
Buses |
SE |
Buses |
SE |
|||||
|
2001 |
898 |
966 |
754 |
811 |
10.5 |
|
26% |
16.5% |
|
2002 |
913 |
999 |
767 |
839 |
9.7 |
26.0 |
35% |
16.3% |
|
2003 |
924 |
1,024 |
776 |
860 |
10.0 |
27.5 |
39% |
16.0% |
|
2004 |
882 |
996 |
741 |
837 |
8.0 |
24.1 |
50% |
16.0% |
|
2005 |
911 |
1,025 |
765 |
861 |
7.8 |
23.3 |
57% |
16.0% |
Transit Fleet Maintenance performs MTO inspections every six months on each bus. Any deficiencies identified in the inspection process are remedied.
Transit Fleet Maintenance performs Drive Clean tests on buses. Heavy duty diesel opacity standards as of April 1, 2005 are as follows:
1990 and older model years: 40%
1991 and newer model years: 30%
The bus fleet averages: 2005 - 812 buses tested - 9.3%, 2006 - 528 buses tested - 10.3%. If a test falls below 20 PPM, the bus does not have to be tested the following year.
This appendix contains a detailed listing of the projects included in the 2006-2015 Capital Plan for transit activities. It also contains the project descriptions included in the 2006 budget for those projects that required funding approvals for 2006.
2006 DRAFT CAPITAL
BUDGET
PROJECT DETAIL ($000's)
|
Project: Bus
Refurbishment Program |
|
2006
Project Request |
4,725 |
|
|||||||||
|
Project
Number:
900297 |
|
Nine
Year Forecast |
61,277 |
|
|||||||||
|
Branch: Fleet Services |
|
Previous
Budget Authority |
33,086 |
|
|||||||||
|
Ward: CW |
|
Total
Revised Authority |
99,088 |
|
|||||||||
|
Category: Renewal of City Assets |
|
|
|
|
|||||||||
|
Year
of Completion:
Ongoing |
|
|
|
|
|||||||||
|
|
|
|
|
|
|||||||||
|
|
|
|
|
|
|||||||||
|
This program is designed to extend the life of over 900 buses in the fleet from the manufacturer’s average 12 year design life to the City's planned life cycle of 18 years. As each bus approaches the nine year mark, they are subjected to periodic appraisals and scheduled for refurbishment according to an assigned priority. The extent of the work performed on the body and power train is dictated by these condition assessments.
This program has been supported by the Government of Ontario since 2002 under its Transit Vehicle programs. The anticipated subsidy associated with this program is based on the published funding rules of the 2005 provincial program. Should the 2006 provincial program be reduced, the 2006 replacement program will be reduced accordingly.
Also included in this program are the parts and labour costs of rebuilding major power train components such as engines and transmissions.
The refurbishment program complements the ongoing maintenance and repair functions and is an efficient and cost effective way of putting the optimum number of safe buses on the road daily. Failure to do this work would result in fewer buses for revenue service. |
|
|||||||||||
|
|
|
|
|
|||||||||
|
|
|
|
|
|
|
|||||||
|
|
2006 |
2007 |
2008 |
2009-2015 |
|
|||||||
|
|
|
|
|
|
|
|||||||
|
Project
Request |
4,725 |
4,940 |
1,500 |
54,837 |
|
|||||||
|
|
|
|
|
|
|
|||||||
|
|
|
|
|
|
|
|||||||
|
Funding |
|
|
|
|
|
|||||||
|
Federal/Provincial
Grants |
1,196 |
1,630 |
495 |
18,096 |
|
|||||||
|
Federal/Provincial
Gas Tax |
3,529 |
3,310 |
1,005 |
36,741 |
|
|||||||
|
|
|
|
|
|
|
|||||||
|
|
|
|
|
|
|
|||||||
|
|
|
|
|
|
|
|||||||
|
Spending Plan |
4,725 |
4,940 |
3,084 |
54,837 |
|
|||||||
|
Full Time Equivalents |
- |
- |
- |
- |
|
|||||||
|
Operating Budget Impact |
- |
- |
- |
- |
|
|||||||
|
|
|
|
|
|
|
|||||||
|
|
|
|
|
|
||||||||
|
Project: Bus
Additions |
|
2006
Project Request |
13,770 |
|
||||||||
|
Project
Number:
900874 |
|
Nine
Year Forecast |
185,429 |
|
||||||||
|
Branch: Transit Services |
|
Previous
Budget Authority |
31,110 |
|
||||||||
|
Ward: CW |
|
Total
Revised Authority |
230,309 |
|
||||||||
|
Category: Growth |
|
|
|
|
||||||||
|
Year
of Completion:
Ongoing |
|
|
|
|
||||||||
|
|
|
|
|
|
||||||||
|
|
|
|
|
|
||||||||
|
The 32 additional buses included in the 2006 capital budget will be delivered in 2007 in time to introduce a 3% increase in peak period transit service directly after Labour Day. This additional capacity will be required to support new development in the suburbs, infill developments in older parts of the City and a small improvement in the peak period modal share from today's 17% towards the TMP goal of 30%.
The anticipated subsidy associated with this project is based on the published funding rules of the 2005 provincial program. Should the 2006 provincial program be reduced, refinancing will need to occur in 2006 from the provincial gas tax program, City reserves, or the 2006 bus additions program reduced accordingly.
Council intends to collect development charges to pay for a portion of this project from future growth development. |
|||||||||||
|
|
|
|
|
||||||||
|
|
|
|
|
|
|||||||
|
|
2006 |
2007 |
2008 |
2009-2015 |
|||||||
|
|
|
|
|
|
|||||||
|
Project
Request |
13,770 |
26,592 |
- |
158,837 |
|||||||
|
|
|
|
|
|
|||||||
|
|
|
|
|
|
|||||||
|
Funding |
|
|
|
|
|||||||
|
Federal/Provincial
Grants |
4,544 |
12,319 |
- |
55,184 |
|||||||
|
Development
Charges |
1,983 |
3,829 |
- |
22,873 |
|||||||
|
Federal/Provincial
Gas Tax |
1,347 |
654 |
- |
19,624 |
|||||||
|
Development
Charge Debt |
- |
- |
- |
6,715 |
|||||||
|
Gas
Tax Debt |
5,896 |
9,790 |
- |
54,441 |
|||||||
|
|
|
|
|
|
|||||||
|
|
|
|
|
|
|||||||
|
|
|
|
|
|
|||||||
|
Spending Plan |
13,770 |
26,592 |
- |
158,837 |
|||||||
|
Full Time Equivalents |
- |
- |
- |
- |
|||||||
|
Operating Budget Impact |
3,110 |
3,595 |
3,598 |
2,219 |
|||||||
|
|
|
|
|
|
|||||||
|
|
|
|
|
||||||||||
|
Project:
Revenue Bus Replacement Program |
|
2006
Project Request |
18,360 |
|
|||||||||
|
Project
Number:
903960 |
|
Nine
Year Forecast |
116,490 |
|
|||||||||
|
Branch: Fleet Services |
|
Previous
Budget Authority |
- |
|
|||||||||
|
Ward: CW |
|
Total
Revised Authority |
134,850 |
|
|||||||||
|
Category: Renewal of City Assets |
|
|
|
|
|||||||||
|
Year
of Completion:
Ongoing |
|
|
|
|
|||||||||
|
|
|
|
|
|
|||||||||
|
|
|
|
|
|
|||||||||
|
This program is designed for the timely renewal or modification of the revenue transit bus fleet. Replacements will primarily be forty-foot, low-floor, wheelchair-accessible buses with air-conditioning and cloth-cushioned seats. Bus modifications are necessary to have buses meet operational requirements that could not be introduced in bus production by the supplier. These modifications are dependent on remaining balances within the program.
This program includes the Fleet Emissions Reduction Strategy (FERS) requirement of introducing diesel-electric hybrid buses between 2007 and 2009. The funds reflect the premium for this technology. The 2006 funding will see buses of 1989 and older vintage replaced after having achieved their useful life of 18 or more years (exceptions may apply for economical reasons as related to previous capital investment through the bus refurbishment program 900297).
This program has been supported by the Government of Ontario since 2002 under its Transit Vehicle programs. The anticipated subsidy associated with this program is based on the published funding rules of the 2005 provincial program. Should the 2006 provincial program be reduced, the 2006 replacement program will be reduced accordingly.
Commitments for bus purchases must be made one year prior to delivery if replacement is to be implemented economically at the end of the buses' useful life.
The reliability of the bus service and the cost of maintenance operations are dependent in part on the timely renewal of the transit fleet. Funding variances from the LRFP2 Forecast transfers the capital requirement by three years while increasing the current requirement for refurbishment. As future years funding has also been reduced from LRFP2 levels, the bus replacement backlog will increase as will operating costs. There will be fewer accessible buses in the fleet compared to LRFP2 projections. |
|
|||||||||||
|
|
|
|
|
|||||||||
|
|
|
|
|
|
|
|||||||
|
|
2006 |
2007 |
2008 |
2009-2015 |
|
|||||||
|
|
|
|
|
|
|
|||||||
|
Project
Request |
18,360 |
39,888 |
9,972 |
66,630 |
|
|||||||
|
|
|
|
|
|
|
|||||||
|
|
|
|
|
|
|
|||||||
|
Funding |
|
|
|
|
|
|||||||
|
Federal/Provincial
Grants |
6,059 |
18,478 |
4,620 |
31,268 |
|
|||||||
|
Tax
Supported Reserves |
- |
- |
3,764 |
- |
|
|||||||
|
Federal/Provincial
Gas Tax |
12,301 |
21,410 |
1,588 |
35,362 |
|
|||||||
|
|
|
|
|
|
|
|||||||
|
|
|
|
|
|
|
|||||||
|
|
|
|
|
|
|
|||||||
|
Spending Plan |
4,256 |
15,694 |
39,888 |
75,012 |
|
|||||||
|
Full Time Equivalents |
- |
- |
- |
- |
|
|||||||
|
Operating Budget Impact |
155 |
155 |
240 |
452 |
|
|||||||
|
|
|
|
|
|
|
|||||||
|
|
|
|
|
||||||||||
|
Project: Bus
Equipment Replacement Program |
|
2006
Project Request |
3,576 |
|
|||||||||
|
Project
Number:
900292 |
|
Nine
Year Forecast |
13,700 |
|
|||||||||
|
Branch: Fleet Services |
|
Previous
Budget Authority |
13,380 |
|
|||||||||
|
Ward: CW |
|
Total
Revised Authority |
30,656 |
|
|||||||||
|
Category: Renewal of City Assets |
|
|
|
|
|||||||||
|
Year
of Completion:
Ongoing |
|
|
|
|
|||||||||
|
|
|
|
|
|
|||||||||
|
|
|
|
|
|
|||||||||
|
This program is designed for the timely replacement of existing bus equipment and shop equipment that has reached its useful life. In order to keep over 900 buses on the road, as well as to ensure the appropriate level of service, various types of tools and equipment require replacement on an ongoing basis, dependent upon age, usage and function.
Mandatory Ministry of Transportation inspections necessitate the maintenance and repair of equipment according to a standard and this project identifies the cost associated with the repair, calibration and replacement of tools as well as shop and test equipment required to meet this standard.
In addition to the ongoing life cycling of these special tools, the following equipment related projects are planned for 2006 to meet legislated, volume driven and council directed programs: Upgrade of the fuelling, washing and interior cleaning area at the Merivale garage. Addition of extra washing and drying capability at the St. Laurent garage to deal with the increasing number of buses with cloth seats. Equip space at each garage for wheel alignment and balancing equipment. Buy out the existing lease of the ULSD fuel tank that expires in 2006. Complete the installation of fall arrest equipment at all garages.
The impact of not proceeding with these larger projects along with ongoing tool repairs/replacements will be to reduce service levels and lead to increased repair times and costs. |
|
|||||||||||
|
|
|
|
|
|||||||||
|
|
|
|
|
|
|
|||||||
|
|
2006 |
2007 |
2008 |
2009-2015 |
|
|||||||
|
|
|
|
|
|
|
|||||||
|
Project
Request |
3,576 |
1,100 |
1,500 |
11,100 |
|
|||||||
|
|
|
|
|
|
|
|||||||
|
|
|
|
|
|
|
|||||||
|
Funding |
|
|
|
|
|
|||||||
|
Federal/Provincial
Gas Tax |
3,576 |
1,100 |
1,500 |
11,100 |
|
|||||||
|
|
|
|
|
|
|
|||||||
|
|
|
|
|
|
|
|||||||
|
|
|
|
|
|
|
|||||||
|
Spending Plan |
6,000 |
3,576 |
2,600 |
11,100 |
|
|||||||
|
Full Time Equivalents |
- |
- |
- |
- |
|
|||||||
|
Operating Budget Impact |
- |
- |
- |
- |
|
|||||||
|
|
|
|
|
|
|
|||||||
|
|
|
|
|
||||||||
|
Project:
Life Cycle Renewal-Transit Facilities 2006 |
|
2006
Project Request |
2,110 |
||||||||
|
Project
Number:
903874 |
|
Nine
Year Forecast |
21,060 |
||||||||
|
Branch: Real Property Asset Management |
|
Previous
Budget Authority |
- |
||||||||
|
Ward: CW |
|
Total
Revised Authority |
23,170 |
||||||||
|
Category: Renewal of City Assets |
|
|
|
||||||||
|
Year
of Completion:
2006 |
|
|
|
||||||||
|
|
|
|
|
||||||||
|
|
|
|
|
||||||||
|
The City of Ottawa owns and operates 10 buildings, 34 transit stations, 5 light rail stations, 7 Park and Ride lots and 5,600 bus stops, with a total value in excess of $237M, directly supporting OC Transpo operations. The portfolio includes buildings such as OC Transpo Administrative Headquarters at the St-Laurent site; the extensive garage and bus maintenance facilities at St-Laurent, Pinecrest and Merivale. Also included is the network of bus shelters and directory boxes and transit stations.
The Real Property Asset Management Branch, through its Comprehensive Asset Management Division, ensures that buildings are able to provide continuous uninterrupted support to City programming by developing and implementing a specific life cycle renewal plan for each building and building component. These life cycle renewal plans are based on planned uses, strategic asset management reviews, the validated condition of the building, as well as input from the users and operating staff of the facility.
This capital program entails a wide assortment of major repairs and replacement work including roofing, heating and cooling systems replacement, overhead door replacement, parking lot re-construction, fencing, building interior finishes, bus shelter and directory box replacement, glazing work at transit stations, etc. Condition audits of the asset inventory also form part of the planned program in order to ensure that life cycle renewal projects are documented and implemented in accordance with stated priorities.
This capital program is required in order to work toward the reliable operation of the City's diverse and aging portfolio of buildings and structures for the public transportation network and to maximize the initial real property investment. The completion of life cycle renewal work will ensure that City transit facilities continue to support core-mandated programs and services and will minimize the number of unforeseen failures, thereby avoiding costly repairs and loss of revenue. The Branch plans to address first those items with a life safety issue or mandated requirement. The remaining projects will address predominant life cycle and asset performance needs.
The entire listing of
the Transit life cycle renewal projects is presented on the pages following
this project information sheet. |
|
|||||||||
|
|
|
|
|
|
|
|||||
|
|
2006 |
2007 |
2008 |
2009-2015 |
|
|||||
|
|
|
|
|
|
|
|||||
|
Project
Request |
2,110 |
2,159 |
2,080 |
16,821 |
|
|||||
|
|
|
|
|
|
|
|||||
|
|
|
|
|
|
|
|||||
|
Funding |
|
|
|
|
|
|||||
|
Tax
Supported Reserves |
- |
- |
2,080 |
- |
|
|||||
|
Federal/Provincial
Gas Tax |
2,110 |
2,159 |
- |
16,821 |
|
|||||
|
|
|
|
|
|
|
|||||
|
|
|
|
|
|
|
|||||
|
|
|
|
|
|
|
|||||
|
Spending Plan |
2,110 |
2,159 |
2,080 |
16,821 |
|
|||||
|
Full Time Equivalents |
- |
- |
- |
- |
|
|||||
|
Operating Budget Impact |
- |
- |
- |
- |
|
|||||
|
|
|
|
|
|
|
|||||
Life Cycle Renewal-Transit Facilities 2006
|
Ward |
Location |
Description |
2006 |
|
00 |
City Wide |
Fixed Ladder Remediation Program |
50 |
| |
Annual Map Case & Route Box Replacement Program |
50 |
|
| Annual Transitway Shelter/Bench Replacement Program |
100 |
||
| Tunnel Ventilation Remediation Program |
300 |
||
|
01 |
Place D'Orleans Transitway Station |
Replace Stair Nosing on Northside Stairwell |
20 |
|
03 |
Office And Garage - Merivale - Oc Transpo |
Replace Roof Area 3,4,6 |
500 |
|
07 |
Bus Storage - Pinecrest |
Replace Bus Wash System |
400 |
|
12 |
Campus Transitway Station |
Repair or Replace Glazed Block Walls |
10 |
| |
Replace Inverter System With Generator |
100 |
|
|
17 |
Smyth Transitway Station |
Replace Finish at Entrance Steps & Landings |
6 |
| Dow's Lake Tunnel Utility Station |
Design Only - Generator Replacement |
14 |
|
|
18 |
Administration Building - Oc Transpo |
Design Only - Upgrade Elevator No. 1 |
25 |
| South Garage - St. Laurent |
Brickwork/Foundation Exterior Envelope Repairs |
50 |
|
| |
Replace Emergency Power Panels Txfrs Starters Countdown Area |
20 |
|
| Replace O/H Doors & Disconnects in Original Repair Bays |
60 |
||
| Replace Roof Area 1,4 |
400 |
||
| St Laurent Transitway Station |
Recaulk Control & Expansion Joints |
5 |
|
|
|
|
Total |
2,110 |
|
|
|
|
|
|
|||||||||
|
Project:
Transit Facilities-Operational Response 06 |
|
2006
Project Request |
2,068 |
|
|||||||||
|
Project
Number:
903880 |
|
Nine
Year Forecast |
16,752 |
|
|||||||||
|
Branch: Real Property Asset Management |
|
Previous
Budget Authority |
- |
|
|||||||||
|
Ward: CW |
|
Total
Revised Authority |
18,820 |
|
|||||||||
|
Category: Renewal of City Assets |
|
|
|
|
|||||||||
|
Year
of Completion:
2006 |
|
|
|
|
|||||||||
|
|
|
|
|
|
|||||||||
|
|
|
|
|
|
|||||||||
|
The City of Ottawa owns and operates 10 buildings, 34 transit stations, 5 light rail stations, 7 Park and Ride lots and 5,600 bus stops directly supporting OC Transpo operations. The Real Property Asset Management Branch, through its Venture Properties Division, ensures that buildings are able to provide continuous uninterrupted support to that programming.
The Operational Response program is intended to address legislative requirements, health and safety practices, compliance orders, risk management initiatives, repair and upgrades to protect assets, operational delivery improvements, efficiencies and harmonization initiatives. Projects will result in improved efficiency of a facility, from an operational, programming and public use perspective.
Examples of work to be performed are:
• Health and Safety initiatives at Transit Stations • Elevator and escalator upgrades to meet changes in code • Station infrastructure upgrades to meet client and business needs • Site drainage improvements at St Laurent and Merivale garages |
|
|||||||||||
|
|
|
|
|
|||||||||
|
|
|
|
|
|
|
|||||||
|
|
2006 |
2007 |
2008 |
2009-2015 |
|
|||||||
|
|
|
|
|
|
|
|||||||
|
Project
Request |
2,068 |
2,115 |
1,347 |
13,290 |
|
|||||||
|
|
|
|
|
|
|
|||||||
|
|
|
|
|
|
|
|||||||
|
Funding |
|
|
|
|
|
|||||||
|
Tax
Supported Reserves |
- |
- |
1,347 |
- |
|
|||||||
|
Federal/Provincial
Gas Tax |
2,068 |
2,115 |
- |
13,290 |
|
|||||||
|
|
|
|
|
|
|
|||||||
|
|
|
|
|
|
|
|||||||
|
|
|
|
|
|
|
|||||||
|
Spending Plan |
2,068 |
2,115 |
1,347 |
13,290 |
|
|||||||
|
Full Time Equivalents |
- |
- |
- |
- |
|
|||||||
|
Operating Budget Impact |
- |
- |
- |
- |
|
|||||||
|
|
|
|
|
|
|
|||||||
|
|
|
|
|
|
|||||||||
|
Program:
Transit Priority Program |
|
2006
Program Request |
1,613 |
|
|||||
|
Branch: Traffic & Parking Operations |
|
Nine
Year Forecast |
11,430 |
|
|||||
|
Ward: |
|
Previous
Year Authority |
- |
|
|||||
|
Category: Growth |
|
Total
Revised Authority |
13,043 |
|
|||||
|
Year
of Completion:
Ongoing |
|
|
|
|
|||||
|
|
|
|
|
|
|||||
|
|
|
|
|
|
|||||
|
|
|
|
|
|
|||||
|
Transit Priority (TP) measures refer to traffic engineering and management strategies that provide priority to transit vehicles in mixed flow traffic environment. The objective of transit priority measures is to reduce transit travel times and travel time variability along mixed flow roadways. Since the majority of transit services are on mixed flow roadways where 20 to 40% of the scheduled time is unproductive (congestion, signal, time point delay), the potential for improvement is substantial.
Transit priority measures reduce transit travel times, resulting in significant operating and capital cost savings to the City. Reduced transit travel times and improved schedule adherence have a direct positive impact on transit ridership and transit modal share, which is one of the main objectives of the Official Plan.
The Transportation Master Plan calls for the implementation of transit priority measures in future rapid transit corridors as a means of incremental implementation.
Detailed information and cost associated with specific components and projects directly follow the program summary sheet. |
||||||||
|
|
|
|
|
|
||||
|
|
2006 |
2007 |
2008 |
2009-2015 |
||||
|
|
|
|
|
|
||||
|
Program
Request |
1,613 |
1,850 |
3,757 |
5,823 |
||||
|
|
|
|
|
|
||||
|
|
|
|
|
|
||||
|
Funding |
|
|
|
|
||||
|
Development
Charges |
464 |
535 |
1,081 |
174 |
||||
|
Tax
Supported Reserves |
- |
- |
540 |
- |
||||
|
Federal/Provincial
Gas Tax |
849 |
803 |
- |
5,649 |
||||
|
Gas
Tax Debt |
300 |
512 |
2,136 |
- |
||||
|
|
|
|
|
|
||||
|
|
|
|
|
|
||||
|
|
|
|
|
|
||||
|
Spending Plan |
1,613 |
1,850 |
3,757 |
5,823 |
||||
|
Full Time Equivalents |
- |
- |
- |
- |
||||
|
Operating Budget Impact |
120 |
- |
- |
- |
||||
|
|
|
|
|
|
||||
|
|
|
|
|
|
|||||||||
|
Project:
Light Rail One Time Capital |
|
2006
Project Request |
775 |
|
|||||||||
|
Project
Number:
901230 |
|
Nine
Year Forecast |
250 |
|
|||||||||
|
Branch: Transit Services |
|
Previous
Budget Authority |
2,748 |
|
|||||||||
|
Ward: CW |
|
Total
Revised Authority |
3,773 |
|
|||||||||
|
Category: Growth |
|
|
|
|
|||||||||
|
Year
of Completion:
Ongoing |
|
|
|
|
|||||||||
|
|
|
|
|
|
|||||||||
|
|
|
|
|
|
|||||||||
|
It is necessary to spend $750,000 on the Three Talent trains to keep them in operation and in condition to meet the safety requirements of Transport Canada. $400,000 is required to complete a phased overhaul of the engines (four remain, two were overhauled earlier this year); $250,000 is required to upgrade the Train braking system and $100,000 to replace the train generators, which are already beyond their life expectancy. In addition, $25,000 is needed for vegetation and tree removal. |
|
|||||||||||
|
|
|
|
|
|||||||||
|
|
|
|
|
|
|
|||||||
|
|
2006 |
2007 |
2008 |
2009-2015 |
|
|||||||
|
|
|
|
|
|
|
|||||||
|
Project
Request |
775 |
250 |
- |
- |
|
|||||||
|
|
|
|
|
|
|
|||||||
|
|
|
|
|
|
|
|||||||
|
Funding |
|
|
|
|
|
|||||||
|
Federal/Provincial
Gas Tax |
775 |
250 |
- |
- |
|
|||||||
|
|
|
|
|
|
|
|||||||
|
|
|
|
|
|
|
|||||||
|
|
|
|
|
|
|
|||||||
|
Spending Plan |
775 |
250 |
- |
- |
|
|||||||
|
Full Time Equivalents |
- |
- |
- |
- |
|
|||||||
|
Operating Budget Impact |
- |
- |
- |
- |
|
|||||||
|
|
|
|
|
|
|
|||||||
|
Project: N-S
Light Rail - Phase 1 |
|
2006
Project Request |
724,715 |
|
|||||
|
Project
Number:
903715 |
|
Nine
Year Forecast |
- |
|
|||||
|
Branch: Economic Development & Strategic Proj. |
|
Previous
Budget Authority |
- |
|
|||||
|
Ward: CW |
|
Total
Revised Authority |
724,715 |
|
|||||
|
Category: Growth |
|
|
|
|
|||||
|
Year
of Completion:
Ongoing |
|
|
|
|
|||||
|
|
|
|
|
|
|||||
|
|
|
|
|
|
|||||
|
The North-South Light Rail project is one of the priority initiatives identified in the Transportation Master Plan in support of the 20/20 long-range planning process. Its focus is to develop a transportation system for the future that will minimize the need for new or widened roads while offering efficient alternatives to public transportation. Building on the success of the O-Train pilot project, the recommended system consists of 31 Km of twin track, electrically powered light rail vehicles, 35 stations, four new park and ride lots, and one maintenance and storage facility. The first phase of this line, comprised of 18 stations, three park and rides and 27 Km in length from the Rideau Centre to Woodroffe Ave., is scheduled to open in 2009.
Both the federal and provincial governments have indicated their support for this light rail transit system in Ottawa, pledging an investment of $200Million each toward the project.
The project is being undertaken as a Public Private Partnership (P3) in order to maximize the project's value for taxpayer dollars. A competitive procurement process is being used to select a consortium to design, build and maintain the new system for 15 years.
Council intends to collect development charges to pay for a portion of this project from future growth development. |
||||||||
|
|
|
|
|
|
||||
|
|
2006 |
2007 |
2008 |
2009-2015 |
||||
|
|
|
|
|
|
||||
|
Project
Request |
724,715 |
- |
- |
- |
||||
|
|
|
|
|
|
||||
|
|
|
|
|
|
||||
|
Funding |
|
|
|
|
||||
|
Federal/Provincial
Grants |
400,000 |
- |
- |
- |
||||
|
Development
Charges |
109,288 |
- |
- |
- |
||||
|
Federal/Provincial
Gas Tax |
21,779 |
- |
- |
- |
||||
|
Development
Charge Debt |
8,066 |
- |
- |
- |
||||
|
Gas
Tax Debt |
185,582 |
- |
- |
- |
||||
|
|
|
|
|
|
||||
|
|
|
|
|
|
||||
|
|
|
|
|
|
||||
|
Spending Plan |
75,000 |
240,000 |
240,000 |
169,715 |
||||
|
Full Time Equivalents |
- |
- |
- |
- |
||||
|
Operating Budget Impact |
- |
- |
- |
- |
||||
|
|
|
|
|
|
||||
|
|
|
|
|
|
|||||||||
|
Project: N/S
LRT Corridor Ext - Ottawa University |
|
2006
Project Request |
5,000 |
|
|||||||||
|
Project
Number:
903926 |
|
Nine
Year Forecast |
- |
|
|||||||||
|
Branch: Economic Development & Strategic Proj. |
|
Previous
Budget Authority |
- |
|
|||||||||
|
Ward: CW |
|
Total
Revised Authority |
5,000 |
|
|||||||||
|
Category: Growth |
|
|
|
|
|||||||||
|
Year
of Completion:
2009 |
|
|
|
|
|||||||||
|
|
|
|
|
|
|||||||||
|
|
|
|
|
|
|||||||||
|
As part of the review of bus transit operations on Albert and Slater Streets it is recommended that the Light Rail Transit corridor be extended from the Rideau Centre to the University of Ottawa, east of Waller Street and alongside Stewart Street. This extension would be completed as part of a public-private partnership with the University of Ottawa and would involve an integrated light rail station with underground parking and future above grade development. Funding authority is required now to finance the cost of the light rail extension only. Additional funding will be identified once the details of the partnership are defined.
|
|
|||||||||||
|
|
|
|
|
|||||||||
|
|
|
|
|
|
|
|||||||
|
|
2006 |
2007 |
2008 |
2009-2015 |
|
|||||||
|
|
|
|
|
|
|
|||||||
|
Project
Request |
5,000 |
- |
- |
- |
|
|||||||
|
|
|
|
|
|
|
|||||||
|
|
|
|
|
|
|
|||||||
|
Funding |
|
|
|
|
|
|||||||
|
Gas
Tax Debt |
5,000 |
- |
- |
- |
|
|||||||
|
|
|
|
|
|
|
|||||||
|
|
|
|
|
|
|
|||||||
|
|
|
|
|
|
|
|||||||
|
Spending Plan |
3,000 |
2,000 |
- |
- |
|
|||||||
|
Full Time Equivalents |
- |
- |
- |
- |
|
|||||||
|
Operating Budget Impact |
- |
- |
- |
- |
|
|||||||
|
|
|
|
|
|
|
|||||||
Reference Map:
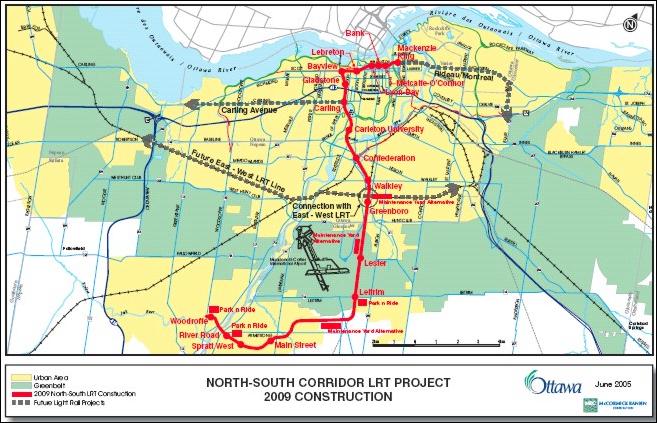
|
|
|
|
|
|
|||||||||
|
Project:
Park and Ride Expansion Prog - Studies |
|
2006
Project Request |
50 |
|
|||||||||
|
Project
Number:
903272 |
|
Nine
Year Forecast |
610 |
|
|||||||||
|
Branch: Planning Environment & Infra. Policy |
|
Previous
Budget Authority |
150 |
|
|||||||||
|
Ward: CW |
|
Total
Revised Authority |
810 |
|
|||||||||
|
Category: Growth |
|
|
|
|
|||||||||
|
Year
of Completion:
2014 |
|
|
|
|
|||||||||
|
|
|
|
|
|
|||||||||
|
|
|
|
|
|
|||||||||
|
The City Official Plan and Transportation Master Plan include several requirements to achieve transit modal split targets and commit Council to provide strategically located park and ride lots to provide access to urban transit for commuters from the rural areas as well as from the urban area.
The existing park-and-ride lots are very popular and are fully utilized on a daily basis. Some lots are accommodating vehicles well above their design limit. This account is for studies to explore possible solutions to alleviate the capacity shortage being experienced at these lots, to estimate future potential demand, and to identify locations of future park and ride lots as well as estimated costs and priorities of implementation.
The project is identified in the 2006 Planning and Growth Management Departmental Business Plan as an action to support the Smart Growth Agenda. |
|
|||||||||||
|
|
|
|
|
|||||||||
|
|
|
|
|
|
|
|||||||
|
|
2006 |
2007 |
2008 |
2009-2015 |
|
|||||||
|
|
|
|
|
|
|
|||||||
|
Project
Request |
50 |
50 |
50 |
510 |
|
|||||||
|
|
|
|
|
|
|
|||||||
|
|
|
|
|
|
|
|||||||
|
Funding |
|
|
|
|
|
|||||||
|
Development
Charges |
22 |
22 |
22 |
219 |
|
|||||||
|
Tax
Supported Reserves |
- |
- |
28 |
- |
|
|||||||
|
Federal/Provincial
Gas Tax |
28 |
28 |
- |
291 |
|
|||||||
|
|
|
|
|
|
|
|||||||
|
|
|
|
|
|
|
|||||||
|
|
|
|
|
|
|
|||||||
|
Spending Plan |
50 |
50 |
50 |
510 |
|
|||||||
|
Full Time Equivalents |
- |
- |
- |
- |
|
|||||||
|
Operating Budget Impact |
- |
- |
- |
- |
|
|||||||
|
|
|
|
|
|
|
|||||||
|
|
|
|
|
|
|||||||||
|
Project:
Automated Fare Collection |
|
2006
Project Request |
975 |
|
|||||||||
|
Project
Number:
900300 |
|
Nine
Year Forecast |
10,600 |
|
|||||||||
|
Branch: Transit Services |
|
Previous
Budget Authority |
955 |
|
|||||||||
|
Ward: CW |
|
Total
Revised Authority |
12,530 |
|
|||||||||
|
Category: Growth |
|
|
|
|
|||||||||
|
Year
of Completion:
Ongoing |
|
|
|
|
|||||||||
|
|
|
|
|
|
|||||||||
|
|
|
|
|
|
|||||||||
|
Transit Services will be introducing a Smartcard fare system over the next three years. The system will need to be in place by the time the LRT system is introduced in 2009. The system will use proximity smart cards that will be configured as passes or electronic tickets and will have major benefits for the transit system: it will be possible to introduce innovative fare options (such as personal 'Ecopass' by direct debit, weekly passes, fare by time of day, or fare by distance); allow partnerships with businesses; reduce fare fraud and reduce boarding times.
The system will be built on the communications foundation that is being developed for the GPS system, which is due to be completed in the spring of 2006. It will be designed to be compatible with the STO electronic fare system to allow the policy of making transfers between OC Transpo and STO as seamless as possible.
|
|
|||||||||||
|
|
|
|
|
|||||||||
|
|
|
|
|
|
|
|||||||
|
|
2006 |
2007 |
2008 |
2009-2015 |
|
|||||||
|
|
|
|
|
|
|
|||||||
|
Project
Request |
975 |
7,000 |
3,600 |
- |
|
|||||||
|
|
|
|
|
|
|
|||||||
|
|
|
|
|
|
|
|||||||
|
Funding |
|
|
|
|
|
|||||||
|
Federal/Provincial
Gas Tax |
975 |
7,000 |
3,600 |
- |
|
|||||||
|
|
|
|
|
|
|
|||||||
|
|
|
|
|
|
|
|||||||
|
|
|
|
|
|
|
|||||||
|
Spending Plan |
975 |
7,000 |
3,600 |
- |
|
|||||||
|
Full Time Equivalents |
- |
- |
- |
- |
|
|||||||
|
Operating Budget Impact |
- |
- |
- |
- |
|
|||||||
|
|
|
|
|
|
|
|||||||
|
|
|
|
|
|
|||||||||
|
Project:
Integrated Voice Response System |
|
2006
Project Request |
125 |
|
|||||||||
|
Project
Number:
900362 |
|
Nine
Year Forecast |
- |
|
|||||||||
|
Branch: Transit Services |
|
Previous
Budget Authority |
1,062 |
|
|||||||||
|
Ward: CW |
|
Total
Revised Authority |
1,187 |
|
|||||||||
|
Category: Strategic Initiatives - Corp.& Bus.
Plan |
|
|
|
|
|||||||||
|
Year
of Completion:
Ongoing |
|
|
|
|
|||||||||
|
|
|
|
|
|
|||||||||
|
|
|
|
|
|
|||||||||
|
The purpose of this project is to provide the hardware, software and other information technology services required to support the business of Para Transpo
Major Project/Program Deliverables 1. Upgrades and new functionality for Para Transpo computerized scheduling and dispatch system hardware and software 2. Upgrades and enhancements to Para Transpo radio system 3. Upgrades and enhancements to other core business applications
Accomplishments to Date (30 Sep 05) 1. Upgraded mapping system to reflect new City boundaries and improve scheduling 2. Installed new servers 3. Added GPS software 4. Custom reports 5. Upgraded dispatch and scheduling software
2006 Plan Key Activities 1. Installation of automated reservation system using interactive voice response 2. Integration of information from Global Positioning System technology 3. Replacement of desktop PCs |
|
|||||||||||
|
|
|
|
|
|||||||||
|
|
|
|
|
|
|
|||||||
|
|
2006 |
2007 |
2008 |
2009-2015 |
|
|||||||
|
|
|
|
|
|
|
|||||||
|
Project
Request |
125 |
- |
- |
- |
|
|||||||
|
|
|
|
|
|
|
|||||||
|
|
|
|
|
|
|
|||||||
|
Funding |
|
|
|
|
|
|||||||
|
Development
Charges |
54 |
- |
- |
- |
|
|||||||
|
Tax
Supported Reserves |
71 |
- |
- |
- |
|
|||||||
|
|
|
|
|
|
|
|||||||
|
|
|
|
|
|
|
|||||||
|
|
|
|
|
|
|
|||||||
|
Spending Plan |
125 |
- |
- |
- |
|
|||||||
|
Full Time Equivalents |
- |
- |
- |
- |
|
|||||||
|
Operating Budget Impact |
- |
- |
- |
- |
|
|||||||
|
|
|
|
|
|
|
|||||||
|
|
|
|
|
|
|||||||||
|
Project:
Transit Vehicle Information Systems |
|
2006
Project Request |
380 |
|
|||||||||
|
Project
Number:
900516 |
|
Nine
Year Forecast |
- |
|
|||||||||
|
Branch: Transit Services |
|
Previous
Budget Authority |
5,410 |
|
|||||||||
|
Ward: CW |
|
Total
Revised Authority |
5,790 |
|
|||||||||
|
Category: Strategic Initiatives - Corp.& Bus.
Plan |
|
|
|
|
|||||||||
|
Year
of Completion:
Ongoing |
|
|
|
|
|||||||||
|
|
|
|
|
|
|||||||||
|
|
|
|
|
|
|||||||||
|
The purpose of this project is to implement a SmartBus system in all Transit Services revenue vehicles. This system uses a global positioning system to track vehicle movements and monitor schedule adherence
Major Project/Program Deliverables
1. Enable all Transit Services revenue vehicles to be monitored in real time and improve on-street service delivery 2. Improve employee and passenger safety 3. Improve efficiency, reduce operating and maintenance costs 4. Increase service reliability, schedule adherence, and increase ridership 5. Improve communications between service controllers, dispatch and operating staff
Accomplishments to Date (30 Sep 05)
1. Selected technology vendor 2. Successful completion of pilot project to confirm technology selection 3. Delivered full cost/benefits analysis showing return on investment 4. Negotiated contract with vendor for full deployment 5. Developed installation process and schedule for multiple vehicle types 6. Upgraded supporting technology infrastructure
2006 Plan Key Activities
1. Deployment of SmartBus system in all OC Transpo and Para Transpo vehicles 2. Complete conversion of existing Transfer Printers and integrate with SmartBus system |
|
|||||||||||
|
|
|
|
|
|||||||||
|
|
|
|
|
|
|
|||||||
|
|
2006 |
2007 |
2008 |
2009-2015 |
|
|||||||
|
|
|
|
|
|
|
|||||||
|
Project
Request |
380 |
- |
- |
- |
|
|||||||
|
|
|
|
|
|
|
|||||||
|
|
|
|
|
|
|
|||||||
|
Funding |
|
|
|
|
|
|||||||
|
Tax
Supported Reserves |
380 |
- |
- |
- |
|
|||||||
|
|
|
|
|
|
|
|||||||
|
|
|
|
|
|
|
|||||||
|
|
|
|
|
|
|
|||||||
|
Spending Plan |
380 |
- |
- |
- |
|
|||||||
|
Full Time Equivalents |
- |
- |
- |
- |
|
|||||||
|
Operating Budget Impact |
- |
250 |
- |
- |
|
|||||||
|
|
|
|
|
|
|
|||||||
|
|
|
|
|
|
|||||||||
|
Project:
Smart Growth Transit Control Centre |
|
2006
Project Request |
1,000 |
|
|||||||||
|
Project
Number:
901223 |
|
Nine
Year Forecast |
2,600 |
|
|||||||||
|
Branch: Transit Services |
|
Previous
Budget Authority |
- |
|
|||||||||
|
Ward: CW |
|
Total
Revised Authority |
3,600 |
|
|||||||||
|
Category: Growth |
|
|
|
|
|||||||||
|
Year
of Completion:
Ongoing |
|
|
|
|
|||||||||
|
|
|
|
|
|
|||||||||
|
|
|
|
|
|
|||||||||
|
In order to ensure the seamless delivery of transit services once the LRT system is in place, an integrated control centre at 875 Belfast, which would include Bus and Light Rail Service Control, as well as Security Control and the Telephone Call Centre is planned.
The LRT Control Centre will need to be in place by January 2008, and so facility construction in the summer and fall of 2007 would be needed. Funds included in 2006 are to design the facility and to cover some of the IT requirements.
While the timing of this move is influenced by the LRT implementation, the existing transit control centre has outgrown its current premises at St. Laurent North. More space is needed for both security control and transit control, and this cannot be accommodated at the current location. |
|
|||||||||||
|
|
|
|
|
|||||||||
|
|
|
|
|
|
|
|||||||
|
|
2006 |
2007 |
2008 |
2009-2015 |
|
|||||||
|
|
|
|
|
|
|
|||||||
|
Project
Request |
1,000 |
2,600 |
- |
- |
|
|||||||
|
|
|
|
|
|
|
|||||||
|
|
|
|
|
|
|
|||||||
|
Funding |
|
|
|
|
|
|||||||
|
Development
Charges |
140 |
364 |
- |
- |
|
|||||||
|
Federal/Provincial
Gas Tax |
- |
2,236 |
- |
- |
|
|||||||
|
Gas
Tax Debt |
860 |
- |
- |
- |
|
|||||||
|
|
|
|
|
|
|
|||||||
|
|
|
|
|
|
|
|||||||
|
|
|
|
|
|
|
|||||||
|
Spending Plan |
1,000 |
2,600 |
- |
- |
|
|||||||
|
Full Time Equivalents |
- |
- |
- |
- |
|
|||||||
|
Operating Budget Impact |
- |
- |
- |
- |
|
|||||||
|
|
|
|
|
|
|
|||||||
|
|
|
|
|
|
|||||||||
|
Project:
Transit Computer Systems New Initiatives |
|
2006
Project Request |
342 |
|
|||||||||
|
Project
Number:
902952 |
|
Nine
Year Forecast |
19,930 |
|
|||||||||
|
Branch: Transit Services |
|
Previous
Budget Authority |
1,786 |
|
|||||||||
|
Ward: CW |
|
Total
Revised Authority |
22,058 |
|
|||||||||
|
Category: Growth |
|
|
|
|
|||||||||
|
Year
of Completion:
Ongoing |
|
|
|
|
|||||||||
|
|
|
|
|
|
|||||||||
|
|
|
|
|
|
|||||||||
|
The purpose of this project is to provide the hardware, software and other information technology services required to support the business of OC Transpo (Transit Services).
Major Project/Program Deliverables:
Support of Transit Services scheduling and service control applications, including upgrades and enhancements, core business applications, public information systems, radio systems, Closed Circuit Television (CCTV) Systems, including upgrades, enhancements and new installations.
Accomplishments to Date (31 Sep 05) 1. New booking system information for bus operators 2. New photo ID system for the public and transit employees 3. Further expansion of Federal Government Ecopass system to include 32 departments 4. Replaced 15 obsolete passenger information displays with new technology 5. Improvements to radio system reception and functionality 6. Equipped eight new buses with automatic passenger counting systems 7. Upgraded Transit Operations control centre equipment
2006 Plan - Key Activities: 1. Lifecycle - Increased security CCTV coverage at Transitway stations, accessibility and performance upgrades for octranspo.com, replace obsolete radios and obsolete APC equipment on 8 buses, consolidation of many Transit Pass Management applications, upgrade scheduling and trip planner systems to latest supported version 2. Strategic - Integration of in-house applications with vendor systems for scheduling and trip planning, new wireless and web-based traveler information services to public, develop Transportation Operations applications to replace paper-based processes, provide remote management capabilities for bus technology |
|
|||||||||||
|
|
|
|
|
|||||||||
|
|
|
|
|
|
|
|||||||
|
|
2006 |
2007 |
2008 |
2009-2015 |
|
|||||||
|
|
|
|
|
|
|
|||||||
|
Project
Request |
342 |
3,640 |
3,480 |
12,810 |
|
|||||||
|
|
|
|
|
|
|
|||||||
|
|
|
|
|
|
|
|||||||
|
Funding |
|
|
|
|
|
|||||||
|
Development
Charges |
147 |
1,565 |
1,496 |
5,508 |
|
|||||||
|
Federal/Provincial
Gas Tax |
195 |
2,075 |
1,984 |
7,302 |
|
|||||||
|
|
|
|
|
|
|
|||||||
|
|
|
|
|
|
|
|||||||
|
|
|
|
|
|
|
|||||||
|
Spending Plan |
342 |
3,640 |
3,480 |
12,810 |
|
|||||||
|
Full Time Equivalents |
- |
- |
- |
- |
|
|||||||
|
Operating Budget Impact |
- |
95 |
- |
- |
|
|||||||
|
|
|
|
|
|
|
|||||||
|
|
|
|
|
|
|||||||||
|
Project:
Plant/Threat/Risk Analysis |
|
2006
Project Request |
146 |
|
|||||||||
|
Project
Number:
900518 |
|
Nine
Year Forecast |
- |
|
|||||||||
|
Branch: Transit Services |
|
Previous
Budget Authority |
7,070 |
|
|||||||||
|
Ward: CW |
|
Total
Revised Authority |
7,216 |
|
|||||||||
|
Category: Strategic Initiatives - Other |
|
|
|
|
|||||||||
|
Year
of Completion:
Ongoing |
|
|
|
|
|||||||||
|
|
|
|
|
|
|||||||||
|
|
|
|
|
|
|||||||||
|
Installation of additional CCTV cameras and PA systems at Transitway Stations which currently are not so equipped for facility monitoring purposes and to enhance customer and employee safety and security. |
|
|||||||||||
|
|
|
|
|
|||||||||
|
|
|
|
|
|
|
|||||||
|
|
2006 |
2007 |
2008 |
2009-2015 |
|
|||||||
|
|
|
|
|
|
|
|||||||
|
Project
Request |
146 |
- |
- |
- |
|
|||||||
|
|
|
|
|
|
|
|||||||
|
|
|
|
|
|
|
|||||||
|
Funding |
|
|
|
|
|
|||||||
|
Tax
Supported Reserves |
146 |
- |
- |
- |
|
|||||||
|
|
|
|
|
|
|
|||||||
|
|
|
|
|
|
|
|||||||
|
|
|
|
|
|
|
|||||||
|
Spending Plan |
146 |
- |
- |
- |
|
|||||||
|
Full Time Equivalents |
- |
- |
- |
- |
|
|||||||
|
Operating Budget Impact |
- |
45 |
- |
- |
|
|||||||
|
|
|
|
|
|
|
|||||||
|
|
|
|
|
||||||||||
|
Project:
Rapid Transit EA Studies |
|
2006
Project Request |
3,500 |
|
|||||||||
|
Project
Number:
902135 |
|
Nine
Year Forecast |
7,875 |
|
|||||||||
|
Branch: Planning Environment & Infra. Policy |
|
Previous
Budget Authority |
2,139 |
|
|||||||||
|
Ward: CW |
|
Total
Revised Authority |
13,514 |
|
|||||||||
|
Category: Growth |
|
|
|
|
|||||||||
|
Year
of Completion:
Ongoing |
|
|
|
|
|||||||||
|
|
|
|
|
|
|||||||||
|
|
|
|
|
|
|||||||||
|
The required first step to implement the rapid transit network expansion is the undertaking of Environmental Assessment (EA) studies for the individual corridor projects that comprise the overall network. These projects directly contribute to the City's Smart Growth agenda through the Ottawa Rapid Transit Expansion Plan as outlined in the 2006 Planning & Growth Management Departmental Business Plan. EA studies follow an established planning process to identify all impacts on the natural and social environment and recommend appropriate mitigation measures; to establish corridors and rights-of-way for property protection purposes, and; to prepare functional designs and establish baseline budgets. Public consultation efforts are included.
Completed Environmental Assessments ensures that future rapid transit corridors are preserved and protected from development and allows the City to acquire property through land dedication as a condition of development, thereby reducing the City's future liability for property acquisition/protection and mitigation requests, and establishing short and long-term capital funding requirements.
On 08 June 2005, Council approved a motion to approve the pre-commitment of $4M in the 2006 budget for the undertaking of the Carling Avenue Corridor LRT Project and the Rideau/Montreal Corridor LRT EA studies in order to have the planning approvals in place to take advantage possible federal and provincial funding programs as they arise. On 20 September 2005, Council approved the transfer of $1M into this account to offset this pre-commitment. |
|
|||||||||||
|
|
|
|
|
|||||||||
|
|
|
|
|
|
|
|||||||
|
|
2006 |
2007 |
2008 |
2009-2015 |
|
|||||||
|
|
|
|
|
|
|
|||||||
|
Project
Request |
3,500 |
485 |
425 |
6,965 |
|
|||||||
|
|
|
|
|
|
|
|||||||
|
|
|
|
|
|
|
|||||||
|
Funding |
|
|
|
|
|
|||||||
|
Development
Charges |
504 |
70 |
61 |
903 |
|
|||||||
|
Tax
Supported Reserves |
- |
160 |
364 |
2,175 |
|
|||||||
|
Federal/Provincial
Gas Tax |
2,996 |
255 |
- |
3,887 |
|
|||||||
|
|
|
|
|
|
|
|||||||
|
|
|
|
|
|
|
|||||||
|
|
|
|
|
|
|
|||||||
|
Spending Plan |
3,500 |
485 |
425 |
6,965 |
|
|||||||
|
Full Time Equivalents |
- |
- |
- |
- |
|
|||||||
|
Operating Budget Impact |
- |
- |
- |
- |
|
|||||||
|
|
|
|
|
|
|
|||||||
|
|
|
|
|
|
|||||||||
|
Project:
Transitway Corridor Protection |
|
2006
Project Request |
500 |
|
|||||||||
|
Project
Number:
902561 |
|
Nine
Year Forecast |
4,395 |
|
|||||||||
|
Branch: Planning Environment & Infra. Policy |
|
Previous
Budget Authority |
901 |
|
|||||||||
|
Ward: CW |
|
Total
Revised Authority |
5,796 |
|
|||||||||
|
Category: Growth |
|
|
|
|
|||||||||
|
Year
of Completion:
Ongoing |
|
|
|
|
|||||||||
|
|
|
|
|
|
|||||||||
|
|
|
|
|
|
|||||||||
|
Although the opportunity to protect for future transportation corridors is, for the most part, achieved by land dedication as a condition of development, it may be necessary on occasion to acquire properties in critical areas to maintain corridor integrity.
The ability to acquire such properties reduces the City's future liability for property acquisition/protection and mitigation requests. |
|
|||||||||||
|
|
|
|
|
|||||||||
|
|
|
|
|
|
|
|||||||
|
|
2006 |
2007 |
2008 |
2009-2015 |
|
|||||||
|
|
|
|
|
|
|
|||||||
|
Project
Request |
500 |
500 |
500 |
3,395 |
|
|||||||
|
|
|
|
|
|
|
|||||||
|
|
|
|
|
|
|
|||||||
|
Funding |
|
|
|
|
|
|||||||
|
Development
Charges |
216 |
216 |
216 |
1,470 |
|
|||||||
|
Tax
Supported Reserves |
- |
284 |
284 |
275 |
|
|||||||
|
Federal/Provincial
Gas Tax |
284 |
- |
- |
1,650 |
|
|||||||
|
|
|
|
|
|
|
|||||||
|
|
|
|
|
|
|
|||||||
|
|
|
|
|
|
|
|||||||
|
Spending Plan |
500 |
500 |
500 |
3,395 |
|
|||||||
|
Full Time Equivalents |
- |
- |
- |
- |
|
|||||||
|
Operating Budget Impact |
- |
- |
- |
- |
|
|||||||
|
|
|
|
|
|
|
|||||||
|
|
|
|
|
|
|||||
|
Project:
West Transitway (Bayshore to Pinecrest) |
|
2006
Project Request |
1,100 |
|
|||||
|
Project
Number:
903274 |
|
Nine
Year Forecast |
28,000 |
|
|||||
|
Branch: Planning Environment & Infra. Policy |
|
Previous
Budget Authority |
- |
|
|||||
|
Ward: 07 |
|
Total
Revised Authority |
29,100 |
|
|||||
|
Category: Growth |
|
|
|
|
|||||
|
Year
of Completion:
2007 |
|
|
|
|
|||||
|
|
|
|
|
|
|||||
|
|
|
|
|
|
|||||
|
The extension of the West Transitway from Bayshore Station to Pinecrest Avenue is identified as a Phase I priority in the TMP and directly contributes to the City's Smart Growth agenda through the Ottawa Rapid Transit Expansion Plan as outlined in the 2006 Planning & Growth Management Departmental Business Plan. The construction of this section of transitway will reduce the annual operating costs of OC Transpo and is vital to achieving the 30% transit modal split target by optimizing OC Transpo operations through the Highway 417/416 interchange area.
Previous commitments include the Environmental Assessment study - approved in 1994, and the realignment of Dumaurier Avenue which was completed 1998. The 2006 budget request is for the completion of the detailed design, including obtaining all necessary approvals.
This project will not proceed without receipt of subsidy from funding partners. |
||||||||
|
|
|
|
|
|
||||
|
|
2006 |
2007 |
2008 |
2009-2015 |
||||
|
|
|
|
|
|
||||
|
Project
Request |
1,100 |
28,000 |
- |
- |
||||
|
|
|
|
|
|
||||
|
|
|
|
|
|
||||
|
Funding |
|
|
|
|
||||
|
Development
Charges |
158 |
4,032 |
- |
- |
||||
|
Tax
Supported Reserves |
- |
5,468 |
- |
- |
||||
|
Gas
Tax Debt |
942 |
- |
- |
- |
||||
|
Other
Revenue |
- |
18,500 |
- |
- |
||||
|
|
|
|
|
|
||||
|
|
|
|
|
|
||||
|
|
|
|
|
|
||||
|
Spending Plan |
1,100 |
5,000 |
10,000 |
13,000 |
||||
|
Full Time Equivalents |
- |
- |
- |
- |
||||
|
Operating Budget Impact |
- |
- |
- |
- |
||||
|
|
|
|
|
|
||||
Reference Map:
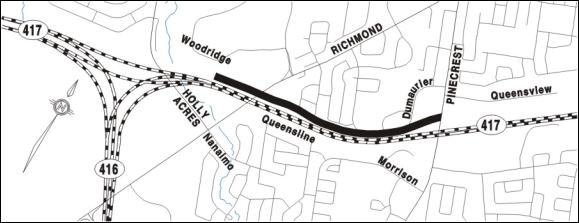
|
|
|
|
|
||||||
|
Project: W
Transitway Corridor/Terry Fox-Eagleson |
|
2006
Project Request |
1,000 |
|
|||||
|
Project
Number:
903280 |
|
Nine
Year Forecast |
46,000 |
|
|||||
|
Branch: Planning Environment & Infra. Policy |
|
Previous
Budget Authority |
- |
|
|||||
|
Ward: 04 |
|
Total
Revised Authority |
47,000 |
|
|||||
|
Category: Growth |
|
|
|
|
|||||
|
Year
of Completion:
2013 |
|
|
|
|
|||||
|
|
|
|
|
|
|||||
|
|
|
|
|
|
|||||
|
The West Transitway from Eagleson Road to the Terry Fox Station is required to provide fast, reliable service to/from downtown for Kanata area residents. The TMP phasing identifies the project as a Phase 2 priority.
Environmental Assessment and Addendum - approved 2001
Recommended to advance design funds to update preliminary designs and complete EA modifications at the Eagleson Road interchange and adjacent to Hwy 417 in coordination with MTO. |
||||||||
|
|
|
|
|
|
||||
|
|
2006 |
2007 |
2008 |
2009-2015 |
||||
|
|
|
|
|
|
||||
|
Project
Request |
1,000 |
- |
- |
46,000 |
||||
|
|
|
|
|
|
||||
|
|
|
|
|
|
||||
|
Funding |
|
|
|
|
||||
|
Federal/Provincial
Grants |
- |
- |
- |
30,600 |
||||
|
Gas
Tax Debt |
1,000 |
- |
- |
15,400 |
||||
|
|
|
|
|
|
||||
|
|
|
|
|
|
||||
|
|
|
|
|
|
||||
|
Spending Plan |
1,000 |
- |
- |
46,000 |
||||
|
Full Time Equivalents |
- |
- |
- |
- |
||||
|
Operating Budget Impact |
- |
- |
- |
- |
||||
|
|
|
|
|
|
||||
Reference Map:
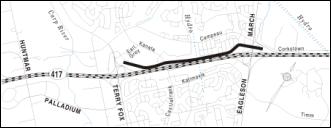
|
Transitway System
Improvements Growth
Annual Requirement |
Order No: |
903401 |
|||||||||||||||||||||||||||||||||||||||||||
|
Ward: |
CW |
||||||||||||||||||||||||||||||||||||||||||||
|
This is an ongoing program to undertake improvements to the Transitway relating to safety modifications, reduce bus travel times, bus service reliability, promote transit service, unforeseen minor platform improvements, and to assist in reducing transit operating costs. |
|||||||||||||||||||||||||||||||||||||||||||||
|
Rank |
|
|
||||||||||||||||||||||||||||||||||||||||||
|
Locations |
|
|
|
||||||||||||||||||||||||||||||||||||||||||
|
Ward |
Street |
Location/Description |
$’000 |
Cumulative |
|||||||||||||||||||||||||||||||||||||||||
|
14 |
Laurier
Ave |
Centre
median for ped safety |
50 |
50 |
|||||||||||||||||||||||||||||||||||||||||
|
17 |
Lees
Ave Campus Station |
Ped
safety improvements |
250 |
300 |
|||||||||||||||||||||||||||||||||||||||||
|
12 |
Rideau
Street |
Platform
safety |
- |
300 |
|||||||||||||||||||||||||||||||||||||||||
|
|
|
Cutoff
|
|
|
|||||||||||||||||||||||||||||||||||||||||
|
13 |
St
Laurent Station |
Platform
Improvements |
- |
- |
|||||||||||||||||||||||||||||||||||||||||
|
7 |
Lincoln
Fields Stn |
Functional
Review Study |
- |
- |
|||||||||||||||||||||||||||||||||||||||||
|
17 |
Hurdman
Station |
Functional
Review Study |
- |
- |
|||||||||||||||||||||||||||||||||||||||||
|
8 |
Baseline
Stn to Algonquin |
Pedestrian
Bridge |
- |
- |
|||||||||||||||||||||||||||||||||||||||||
|
|
|
|
|
||||||||||||||||||||||||||||||||||||||||||
|
Total
2006 Authority Requests |
|||||||||||||||||||||||||||||||||||||||||||||
|
|
|
||||||||||||||||||||||||||||||||||||||||||||
|
Infrastructure
Services |
2006 Detailed Project Listing |
||||||||||||||||||||||||||||||||||||||||||||
|
Transitway Program |
Total: 5,526 |
||||||||||||||||||||||||||||||||||||||||||||
|
Transitway Capital
Works Growth
Annual Requirement |
Order No: |
903402 |
|||||||||||||||||||||||||||||||||||||||||||
|
Ward: |
|
||||||||||||||||||||||||||||||||||||||||||||
|
Works for these 2006 projects include station environmental and safety upgrades, station infrastructure rehabilitation and new installations.
This program is for Transitway Station Capital works projects that are managed by Transit Services. These works include the rehabilitation to station electrical, mechanical and communication operation infrastructure, glazing modifications and refinishing, installation of new emergency communication equipment, the installation of surveillance systems at Transitway Stations, signage improvements and minor facility upgrades for accessibility requirements. |
|||||||||||||||||||||||||||||||||||||||||||||
|
Rank |
|
|
||||||||||||||||||||||||||||||||||||||||||
|
Locations |
|
|
|
||||||||||||||||||||||||||||||||||||||||||
|
Ward |
Street |
Location/Description |
$’000 |
Cumulative |
|||||||||||||||||||||||||||||||||||||||||
|
CW |
|
New
Stn/park & ride facility fitup equip |
250 |
250 |
|||||||||||||||||||||||||||||||||||||||||
|
CW |
|
Environment,
safety and accessibility |
150 |
400 |
|||||||||||||||||||||||||||||||||||||||||
|
CW |
|
Station
equipment rehab/replacement |
196 |
596 |
|||||||||||||||||||||||||||||||||||||||||
|
CW |
|
New
surveillance system installations |
200 |
796 |
|||||||||||||||||||||||||||||||||||||||||
|
|
|
|
|
||||||||||||||||||||||||||||||||||||||||||
|
|
|
|
|
|
|||||||||
|
Project:
Transportation Master Plan |
|
2006
Project Request |
1,200 |
|
|||||||||
|
Project
Number:
903513 |
|
Nine
Year Forecast |
3,800 |
|
|||||||||
|
Branch: Planning Environment & Infra. Policy |
|
Previous
Budget Authority |
200 |
|
|||||||||
|
Ward: CW |
|
Total
Revised Authority |
5,200 |
|
|||||||||
|
Category: Growth |
|
|
|
|
|||||||||
|
Year
of Completion:
Ongoing |
|
|
|
|
|||||||||
|
|
|
|
|
|
|||||||||
|
|
|
|
|
|
|||||||||
|
The 2003 Transportation Master Plan (TMP) for the City of Ottawa has set long-term goals and objectives for travel demand and system performance. The TMP identified the infrastructure, service and program needs and supporting policies to the year 2021.
Updating and reviewing priorities for infrastructure and programs in the plan is required on a regular basis to reflect actual population and employment growth rather those assumed during the preparation of the TMP. The outcomes of the review will be used as a basis for annual budget preparation.
This account is also used for conducting transportation policy studies to support the TMP and for establishing monitoring programs and procedures to provide regular, meaningful insight into future transportation conditions. Current and future projects include: completing New Noise Guidelines, Harmonization of Rural Road Right of Way, Transit Oriented Development Guidelines, Phase 3&4 of TMP monitoring and Development of Ridership Growth Plan.
The update and monitoring of the TMP is identified in the 2006 Planning and Growth Management Departmental Business Plan. |
|
|||||||||||
|
|
|
|
|
|||||||||
|
|
|
|
|
|
|
|||||||
|
|
2006 |
2007 |
2008 |
2009-2015 |
|
|||||||
|
|
|
|
|
|
|
|||||||
|
Project
Request |
1,200 |
600 |
300 |
2,900 |
|
|||||||
|
|
|
|
|
|
|
|||||||
|
|
|
|
|
|
|
|||||||
|
Funding |
|
|
|
|
|
|||||||
|
Development
Charges |
516 |
258 |
129 |
763 |
|
|||||||
|
Tax
Supported Reserves |
- |
67 |
171 |
467 |
|
|||||||
|
Federal/Provincial
Gas Tax |
684 |
275 |
- |
1,670 |
|
|||||||
|
|
|
|
|
|
|
|||||||
|
|
|
|
|
|
|
|||||||
|
|
|
|
|
|
|
|||||||
|
Spending Plan |
1,200 |
600 |
300 |
2,900 |
|
|||||||
|
Full Time Equivalents |
- |
- |
- |
- |
|
|||||||
|
Operating Budget Impact |
- |
- |
- |
- |
|
|||||||
|
|
|
|
|
|
|
|||||||
|
Traffic
& Parking Operations |
2006 Detailed Project Listing |
||||||||||||||||||||||||||||||||||||||||||||
|
Transit
Priority Program |
Total: 1,613 |
||||||||||||||||||||||||||||||||||||||||||||
|
Transit Priority
Measures Parallel Corridors Growth
Ongoing |
Order No: |
903740 |
|||||||||||||||||||||||||||||||||||||||||||
|
Ward: |
CW |
||||||||||||||||||||||||||||||||||||||||||||
|
Transit Priority (TP) measures are planned for the Baseline-Heron corridor, extending from Richmond Road to Data Centre Road. This corridor is identified in the Transit Priority Network, part of the approved Transportation Master Plan.
The objective of transit priority measures is to reduce transit travel times and travel time variability along this critical corridor. Examples of transit priority measures to be implemented on Baseline Road and on Heron Road include: sections of bus lanes (created by converting/sharing existing turning lanes or by constructing/extending new lanes), signal priority displays at intersections, queue jumps, infill of mid-block bus bays, bus stop relocation/consolidation, and other modifications.
Implementation of the transit priority measures will be undertaken in two phases. Phase I (2006) will be comprised of measures that can be implemented in the short term. Phase II (2007 and 2008) will include more significant measures, and may require the completion of an EA study.
Implementation must begin in 2006, to permit the phasing in of overall transit system changes related to the implementation of the North-South LRT in 2009. Phase I implementation must be completed by Fall 2006 in order to accommodate increases in ridership in this corridor, displaced by construction activities scheduled to begin on Albert/Slater in Spring 2007. |
|||||||||||||||||||||||||||||||||||||||||||||
|
Rank |
|
|
||||||||||||||||||||||||||||||||||||||||||
|
Locations |
|
|
|
||||||||||||||||||||||||||||||||||||||||||
|
Ward |
Street |
Location/Description |
$’000 |
Cumulative |
|||||||||||||||||||||||||||||||||||||||||
|
8,9, 16,17 |
Baseline
and Heron Corridor |
Signals,
bus bay infill, queue jumps. |
1,000 |
1,000 |
|||||||||||||||||||||||||||||||||||||||||
|
|
|
Cutoff
|
|
|
|||||||||||||||||||||||||||||||||||||||||
|
8,9, 16,17 |
Baseline
and Heron Corridor |
Sections
of bus lanes, intersection mod. |
4,000 |
4,000 |
|||||||||||||||||||||||||||||||||||||||||
|
|
|
|
|
||||||||||||||||||||||||||||||||||||||||||
|
Various Structures -
LRT Feeder Project |
Order No: |
903751 |
||||||||||||||||||||||||||||||||||||||||||
|
Ward: |
CW |
|||||||||||||||||||||||||||||||||||||||||||
|
This project provides dedicated funding associated with existing structure and station repairs and improvements to be undertaken in conjunction with, and in support of LRT implementation.
|
||||||||||||||||||||||||||||||||||||||||||||
|
Rank |
1 |
|
|||||||||||||||||||||||||||||||||||||||||
|
Locations |
|
|
|
|||||||||||||||||||||||||||||||||||||||||
|
Ward |
Street |
Location/Description |
$’000 |
Cumulative |
||||||||||||||||||||||||||||||||||||||||
|
16, 17 |
NS
LRT Bridge SN 015290 |
Over
Rideau @ Carleton |
1,000 |
1,000 |
||||||||||||||||||||||||||||||||||||||||
|
16, 17 |
NS
LRT Tunnel SN 019020 |
Under
Dows Lake/Rideau Canal |
100 |
1,100 |
||||||||||||||||||||||||||||||||||||||||
|
16 |
NS
LRT Culvert SN 058900 |
South
of Brookfield Rd |
50 |
1,150 |
||||||||||||||||||||||||||||||||||||||||
|
16 |
NS
LRT Culvert SN 058900 |
S
Brookfield Rd 0.77km N Walkley Rd NR74 |
20 |
1,170 |
||||||||||||||||||||||||||||||||||||||||
|
10, 16 |
Bank
St S Br (Adjoined NB/SB) |
O/P
NS LRT & CNR SN 055210 |
250 |
1,420 |
||||||||||||||||||||||||||||||||||||||||
|
16 |
Heron
Rd O/P NS LRT |
SN
055260 |
150 |
1,570 |
||||||||||||||||||||||||||||||||||||||||
|
16 |
Riverside Dr
O/P NS LRT |
SN
015280 |
100 |
1,670 |
||||||||||||||||||||||||||||||||||||||||
|
16, 17 |
Prince
of Wales Dr O/P NS LRT |
SN
015870 |
250 |
1,920 |
||||||||||||||||||||||||||||||||||||||||
|
14,15,16 |
Carling
Ave O/P NS LRT |
SN
015860 |
500 |
2,420 |
||||||||||||||||||||||||||||||||||||||||
|
14, 15 |
Young
St Ped O/P NS LRT |
SN
018420 |
80 |
2,500 |
||||||||||||||||||||||||||||||||||||||||
|
14, 15 |
Gladstone
Ave O/P NS LRT |
SN
015880 |
300 |
2,800 |
||||||||||||||||||||||||||||||||||||||||
|
14, 15 |
Somerset
St O/P NS LRT |
SN
015340 |
250 |
3,050 |
||||||||||||||||||||||||||||||||||||||||
|
12, 14 |
Mackenzie
King Bridge |
SN
012200 |
250 |
3,300 |
||||||||||||||||||||||||||||||||||||||||
|
2 |
Transitway
Station design |
Jeanne
d'Arc Blvd |
500 |
3,800 |
||||||||||||||||||||||||||||||||||||||||
|
4 |
Station
improvements design |
Eagleson
Road |
500 |
4,300 |
||||||||||||||||||||||||||||||||||||||||
|
14 |
Booth
Street Bridge |
|
130 |
4,430 |
||||||||||||||||||||||||||||||||||||||||
|
|
|
Cutoff
|
|
|
||||||||||||||||||||||||||||||||||||||||
|
12, 14 |
Booth
St Bridge O/P Aqueduct |
SN
017030 - Booth St over Aqueduct |
250 |
250 |
||||||||||||||||||||||||||||||||||||||||
|
|
|
|
|
|||||||||||||||||||||||||||||||||||||||||
|
2006 Transit Priority
Measures Growth
|
Order No: |
903787 |
|||||||||||||||||||||||||||||||||||||||||||
|
Ward: |
CW |
||||||||||||||||||||||||||||||||||||||||||||
|
Examples of transit priority measures include: bus lanes (created by converting existing lanes or by constructing new lanes), signal priority at intersections, and queue jumps. |
|||||||||||||||||||||||||||||||||||||||||||||
|
Rank |
|
|
||||||||||||||||||||||||||||||||||||||||||
|
Locations |
|
|
|
||||||||||||||||||||||||||||||||||||||||||
|
Ward |
Street |
Location/Description |
$’000 |
Cumulative |
|||||||||||||||||||||||||||||||||||||||||
|
CW |
Various |
Monitoring
& Evaluation |
200 |
200 |
|||||||||||||||||||||||||||||||||||||||||
|
CW |
Various |
Controller
Software (annual) |
30 |
230 |
|||||||||||||||||||||||||||||||||||||||||
|
CW |
Various |
Bus
Detection (annual) |
100 |
330 |
|||||||||||||||||||||||||||||||||||||||||
|
CW |
Various |
Loops,
Controllers (annual) |
30 |
360 |
|||||||||||||||||||||||||||||||||||||||||
|
CW |
Various |
Corridor
Studies |
100 |
460 |
|||||||||||||||||||||||||||||||||||||||||
|
7,8,9,16 |
Carling
Ave |
Corridor
Implementation (Signals, lanes) |
153 |
613 |
|||||||||||||||||||||||||||||||||||||||||
|
|
|
Cutoff
|
|
|
|||||||||||||||||||||||||||||||||||||||||
|
CW |
Various |
Corridor
Studies |
150 |
150 |
|||||||||||||||||||||||||||||||||||||||||
|
7,8,9,16 |
Carling
& Other Corridors |
Corridor
Implementation - Add'l projects |
238 |
388 |
|||||||||||||||||||||||||||||||||||||||||
|
|
|
|
|
||||||||||||||||||||||||||||||||||||||||||
|
Total
2006 Authority Requests |
|||||||||||||||||||||||||||||||||||||||||||||
|
|
|
||||||||||||||||||||||||||||||||||||||||||||
|
Infrastructure
Services |
2006 Detailed Project Listing |
||||||||||||||||||||||||||||||||||||||||||||
|
Transitway Rehabilitation Program |
Total: 1,670 |
||||||||||||||||||||||||||||||||||||||||||||
|
Transitway
Rehabilitation Renewal
/ Rehabilitation Annual Programming |
Order No: |
903892 |
|||||||||||||||||||||||||||||||||||||||||||
|
Ward: |
CW |
||||||||||||||||||||||||||||||||||||||||||||
|
This is an ongoing program to undertake engineering and construction activities to maintain and rehabilitate the existing transit infrastructure. The activities include asphalt overlays, rehabilitation of concrete pavements and other surface repairs/rehabilitation works at transit stations. |
|||||||||||||||||||||||||||||||||||||||||||||
|
Rank |
|
|
||||||||||||||||||||||||||||||||||||||||||
|
Locations |
|
|
|
||||||||||||||||||||||||||||||||||||||||||
|
Ward |
Street |
Location/Description |
$’000 |
Cumulative |
|||||||||||||||||||||||||||||||||||||||||
|
11 |
Asphalt
Resurf - East TWay |
EB/WB
Lane- Blair Stn to RR 174 |
- |
- |
|||||||||||||||||||||||||||||||||||||||||
|
11 |
Asphalt
Resurf - East TWay |
E/B
Lane- RR174 on ramp to 174 merge |
- |
- |
|||||||||||||||||||||||||||||||||||||||||
|
11 |
Asphalt
Resurf - East TWay |
WB
Blair Rd exit ramp-EB/WB lane split |
- |
- |
|||||||||||||||||||||||||||||||||||||||||
|
14 |
Asphalt
Resurf - Central TWay |
Bayview
O/pass - Waller St. |
- |
- |
|||||||||||||||||||||||||||||||||||||||||
|
17 |
Asphalt
Resurf - East TWay |
EB/WB
Lane-Lees Ave Stn to Rideau Riv Br |
- |
- |
|||||||||||||||||||||||||||||||||||||||||
|
17 |
Asphalt
Resurf - East TWay |
EB/WB
Lane - Rideau Riv Br to Hurdman St |
- |
- |
|||||||||||||||||||||||||||||||||||||||||
|
13 |
Asphalt
Resurf - East TWay |
EB/WB
Lane-St.Laurent Stn. E to W |
- |
- |
|||||||||||||||||||||||||||||||||||||||||
|
2, 11 |
Asphalt
Resurf - East TWay |
EB
Bus Lane- Montreal Rd to Parkway U/P |
- |
- |
|||||||||||||||||||||||||||||||||||||||||
|
|
|
Cutoff
|
|
|
|||||||||||||||||||||||||||||||||||||||||
|
12 |
Sidewalk
Reconst. - Central TW |
E/side
- Laurier Ave to Campus Stn |
- |
- |
|||||||||||||||||||||||||||||||||||||||||
|
15 |
Asphalt
Resurf - Tunney's Stn |
Scott
St - Holland to 100mW |
- |
- |
|||||||||||||||||||||||||||||||||||||||||
|
|
|
|
|
||||||||||||||||||||||||||||||||||||||||||
|
|
|
|
|
||||||
|
Program:
Transitway Program |
|
2006
Program Request |
5,526 |
|
|||||
|
Branch: Infrastructure Services |
|
Nine
Year Forecast |
32,552 |
|
|||||
|
Ward: |
|
Previous
Year Authority |
- |
|
|||||
|
Category: Growth |
|
Total
Revised Authority |
38,078 |
|
|||||
|
Year
of Completion:
Ongoing |
|
|
|
|
|||||
|
|
|
|
|
|
|||||
|
|
|
|
|
|
|||||
|
|
|
|
|
|
|||||
|
As the City roads become more congested, priority for transit vehicles will become more critical to the success of the City's transit strategy in order to meet the objectives of the Transportation Master Plan.
This Transitway Program is comprised of a series of projects that serve to maintain, rehabilitate and protect the City's investment in transit roadways and structures.
Detailed information and costs associated with specific components and projects follows this program summary page.
The 2006 program also provides for dedicated funding associated with existing structure and station repairs and improvements to support near term LRT implementation. |
||||||||
|
|
|
|
|
|
||||
|
|
2006 |
2007 |
2008 |
2009-2015 |
||||
|
|
|
|
|
|
||||
|
Program
Request |
5,526 |
8,650 |
8,246 |
15,656 |
||||
|
|
|
|
|
|
||||
|
|
|
|
|
|
||||
|
Funding |
|
|
|
|
||||
|
Development
Charges |
2,386 |
3,729 |
3,555 |
6,733 |
||||
|
Federal/Provincial
Gas Tax |
2,290 |
2,978 |
- |
2,098 |
||||
|
Gas
Tax Debt |
850 |
1,943 |
4,691 |
6,825 |
||||
|
|
|
|
|
|
||||
|
|
|
|
|
|
||||
|
|
|
|
|
|
||||
|
Spending Plan |
5,526 |
8,650 |
8,246 |
15,656 |
||||
|
Full Time Equivalents |
- |
- |
- |
- |
||||
|
Operating Budget Impact |
- |
- |
- |
- |
||||
|
|
|
|
|
|
||||
|
Transitway Structures |
Order No: |
903893 |
|||||||||||||||||||||||||||||||||||||||||||
|
Ward: |
CW |
||||||||||||||||||||||||||||||||||||||||||||
|
This component of the program provides for the engineering and construction activities relating to repair and rehabilitation of various transitway structures to address deficiencies and to extend their service life. The size and complexity of the projects vary considerably. The activities are scheduled based on needs identified through the Structures Inventory Management System. |
|||||||||||||||||||||||||||||||||||||||||||||
|
Rank |
|
|
||||||||||||||||||||||||||||||||||||||||||
|
Locations |
|
|
|
||||||||||||||||||||||||||||||||||||||||||
|
Ward |
Street |
Location/Description |
$’000 |
Cumulative |
|||||||||||||||||||||||||||||||||||||||||
|
CW |
Design
High Needs Structures |
|
230 |
230 |
|||||||||||||||||||||||||||||||||||||||||
|
15 |
Tunney's
Pasture |
Holland
Ave (SN 059650-1) |
40 |
270 |
|||||||||||||||||||||||||||||||||||||||||
|
15 |
U/P
Northwestern Ave SN 016270 |
Northwestern
Ave over W Transitway |
160 |
430 |
|||||||||||||||||||||||||||||||||||||||||
|
18 |
U/P
Train Station W SN 056660 |
W
Access Rd over E Transitway |
250 |
680 |
|||||||||||||||||||||||||||||||||||||||||
|
15 |
U/P Tunney's Ramp SN 016250 |
Tunney's
Ramp over W Transitway |
160 |
840 |
|||||||||||||||||||||||||||||||||||||||||
|
15 |
U/P Island Park Dr SN 016280 |
Island
Park Dr over W Transitway |
130 |
970 |
|||||||||||||||||||||||||||||||||||||||||
|
|
|
Cutoff
|
|
|
|||||||||||||||||||||||||||||||||||||||||
|
15 |
/P
Tweedsmuir Ave SN 016300 |
Tweedsmuir
Ave over W Transitway |
125 |
125 |
|||||||||||||||||||||||||||||||||||||||||
|
18 |
Train
Station SN 059850-1 |
Ped
Bridge |
50 |
175 |
|||||||||||||||||||||||||||||||||||||||||
|
18 |
U/P
Train Station E SN 056670 |
E
Access Rd over E Transitway |
250 |
425 |
|||||||||||||||||||||||||||||||||||||||||
|
17 |
U/P Nicolas Ramp SN 016040 |
Nicholas
St Off Ramp Over CA Transitway |
100 |
525 |
|||||||||||||||||||||||||||||||||||||||||
|
11 |
U/P
Blair Rd Off Ramp SN226790 |
E
Transitways Under Qwy Off Ramp |
200 |
725 |
|||||||||||||||||||||||||||||||||||||||||
|
17 |
O/P
Hinks Lane SN 056070 |
Hinks
Lane Under SE Transitway |
80 |
805 |
|||||||||||||||||||||||||||||||||||||||||
|
18 |
U/P
Hospital Rd SN 056140 |
Hospital
Rd Over SE Transitway |
80 |
885 |
|||||||||||||||||||||||||||||||||||||||||
|
|
|
|
|
||||||||||||||||||||||||||||||||||||||||||
|
Total
2006 Authority Requests |
|||||||||||||||||||||||||||||||||||||||||||||
|
|
|
||||||||||||||||||||||||||||||||||||||||||||
|
|
|
|
|
|
|||||||||
|
Program:
Transitway Rehabilitation Program |
|
2006
Program Request |
1,670 |
|
|||||||||
|
Branch: Infrastructure Services |
|
Nine
Year Forecast |
10,682 |
|
|||||||||
|
Ward: |
|
Previous
Year Authority |
- |
|
|||||||||
|
Category: Renewal of City Assets |
|
Total
Revised Authority |
12,352 |
|
|||||||||
|
Year
of Completion:
Ongoing |
|
|
|
|
|||||||||
|
|
|
|
|
|
|||||||||
|
|
|
|
|
|
|||||||||
|
|
|
|
|
|
|||||||||
|
As the City roads become more congested, priority for transit vehicles will become ever more critical to the success of the City's transit strategy in order to meet the objectives of the Transportation Master Plan.
This Transitway Rehabilitation Program is comprised of a series of projects that serve to maintain, rehabilitate and protect the City's investment in transit roadways and structures.
Detailed information and costs associated with specific components and projects follows this program summary page.
The 2006 program also provides for dedicated funding associated with existing structure and station repairs and improvements to support near term LRT implementation.
|
|
|||||||||||
|
|
|
|
|
|||||||||
|
|
|
|
|
|
|
|||||||
|
|
2006 |
2007 |
2008 |
2009-2015 |
|
|||||||
|
|
|
|
|
|
|
|||||||
|
Program
Request |
1,670 |
1,696 |
1,526 |
7,460 |
|
|||||||
|
|
|
|
|
|
|
|||||||
|
|
|
|
|
|
|
|||||||
|
Funding |
|
|
|
|
|
|||||||
|
Tax
Supported Reserves |
- |
- |
721 |
- |
|
|||||||
|
Federal/Provincial
Gas Tax |
1,170 |
1,196 |
- |
6,460 |
|
|||||||
|
Gas
Tax Debt |
500 |
500 |
805 |
1,000 |
|
|||||||
|
|
|
|
|
|
|
|||||||
|
|
|
|
|
|
|
|||||||
|
|
|
|
|
|
|
|||||||
|
Spending Plan |
1,670 |
1,696 |
1,526 |
7,460 |
|
|||||||
|
Full Time Equivalents |
- |
- |
- |
- |
|
|||||||
|
Operating Budget Impact |
- |
- |
- |
- |
|
|||||||
|
|
|
|
|
|
|
|||||||
|
YEAR |
Make/Model |
AGE |
Quantity |
Accessible |
Condition Assessment |
Remaining Life |
|
40'
Transit |
|
|
|
|
|
|
|
1978 |
GMC |
27 |
7 |
|
|
1 |
|
1979 |
GMC |
26 |
1 |
|
|
1 |
|
1980 |
GMC |
25 |
4 |
|
|
2 |
|
1981 |
GMC |
24 |
20 |
|
|
2 |
|
1982 |
GMC |
23 |
10 |
|
|
2 |
|
1985 |
GMC
- Classic |
20 |
6 |
|
|
3 |
|
1987 |
GMC
- Classic |
18 |
14 |
|
REFURBISH |
6 |
|
1989 |
GMC
- Classic |
16 |
60 |
|
REFURBISH |
6 |
|
1990 |
New
Flyer |
15 |
55 |
|
|
5 |
|
1991 |
MCI |
14 |
25 |
|
|
6 |
|
1991 |
Orion
V |
14 |
18 |
|
|
1 |
|
1992 |
New
Flyer |
13 |
27 |
|
|
4 |
|
1992 |
Orion
V |
13 |
26 |
|
|
2 |
|
1993 |
Nova |
12 |
30 |
|
REFURBISH |
6 |
|
1997 |
Orion
V |
8 |
20 |
|
|
10 |
|
1997 |
Nova
- LF |
8 |
20 |
Yes |
|
10 |
|
1998 |
Orion
V |
7 |
85 |
|
|
11 |
|
1999 |
Orion
VI |
6 |
140 |
Yes |
|
12 |
|
2004 |
New
Flyer - Invero |
1 |
73 |
Yes |
|
17 |
|
2005 |
New
Flyer - Invero |
0 |
51 |
Yes |
|
18 |
|
60'
Transit |
|
|
|
|
|
|
|
2001 |
New
Flyer - D60LF |
4 |
76 |
Yes |
|
14 |
|
2002 |
New
Flyer - D60LF |
3 |
101 |
Yes |
|
15 |
|
2003 |
New
Flyer - D60LF |
2 |
23 |
Yes |
|
16 |
|
2004 |
New
Flyer - D60LF |
1 |
27 |
Yes |
|
17 |
|
26'
Transit |
|
|
|
|
|
|
|
2005 |
Crestline
- MiniBus |
0 |
1 |
|
|
5 |
|
TOTAL
ACTIVE BUSES |
|
8.0 |
920 |
|
|
|
Technical Specifications are as follows:
q 48.3 m long
q Height 3.6 m above rail
q 72 tons empty -- 89 tons loaded
q Fuel storage capacity: 2 x 750 l
q Fuel oil storage capacity: 2 x 750 l
q Seats 137 (including 17 fold-away seats)
q 500 hp per engine
q Water cooled in-line motor with a horizontal-shaft design with exhaust gas turbocharger and charge cooler. Complies with the exhaust emission requirements of Euro-II contaminant standards:
q Operation 4 stroke
q Power 315 kW
q Max. RPM 1900 / min
q Displacement 11.97 l
q 6 cylinders
q Main = direct-acting, electrically actuated and continuously adjustable air brake (EP brake)
q Two-stage retarder (part of the automatic transmission system
q Indirect, graduated-release compressed air brake with single control valve Fe 115 and operator’s brake valve FB 11
q Electromagnetic rail brake on motorized trucks as friction coefficient-independent brakes for high speed and emergency braking
q Spring loaded brakes on motorized trucks act as a parking brake