3. 2010 WATER LOSS CONTROL SUMMARY
REPORT
OBJET :
STRATÉGIE DE CONTRÔLE DES PERTES EN EAU EN 2010
COMMITTEE RECOMMENDATION
That Council receive this report for
information.
RECOMMANDATION DU COMITÉ
Que le Conseil reçoivent le présent rapport pour information.
Documentation
1.
Deputy City Manager, Infrastructure Services and Community
Sustainability report dated 9 May 2011 (ACS2011-ICS-ESD-0010)
Report
to/Rapport au :
Environment Committee /
Comité de l'environnement
9 May 2011 / le 9 May 2011
Submitted by/Soumis par : Nancy Schepers,
Deputy City Manager/Directrice municipale adjointe, Infrastructure Services and
Community Sustainability/Services d 'infrastructure et Viabilité des
collectivités
Contact Person/Personne ressource : Dixon Weir, General Manager /
Directeur général
Environmental Services / Services environnementaux
(613) 580-2424 x22002, dixon.weir@ottawa.ca
|
Ref N°: ACS2011-ICS-ESD-0010 |
SUBJECT:
|
2010 Water loss control summary report
|
|
|
|
OBJET :
|
REPORT RECOMMENDATION
That the Environment Committee and Council receive this report for
information.
RECOMMANDATION DU RAPPORT
Que le Comité de
l’environnement et le Conseil reçoivent le présent rapport pour information.
EXECUTIVE SUMMARY
A comprehensive water conservation program addresses both the water supply and water demand aspects of a drinking water supply. This report highlights the recent activities of the water supply activities, known as the Water Loss Control program, and provides updated performance measures and initiatives including Apparent and Real Loss Control planned for 2011
In 2010, the active leak control
program eliminated about 1,725 ML of water losses, resulting in direct
operating savings of about $131,000. The
Infrastructure Leakage Index (ILI) is the industry wide key performance measure
of a water loss control program. The
Legal/Risk
Management Implications:
There are no legal/risk management impediments to receiving this report for information.
Financial
Implications:
This report has no financial implications. Funding for the continuation of the Water Loss Control program exists in capital internal order 902043 Water Loss Control program.
Public
Consultation/Input:
Public consultation was not required for this update.
RÉSUMÉ
Un
programme de conservation de l’eau complet aborde les aspects de
l’approvisionnement et de la demande en eau d’un réseau de distribution d’eau.
Le présent rapport souligne les récentes activités en matière de distribution
d’eau, connues sous le nom de programme de Contrôle des pertes d’eau, et
fournit des mesures et des initiatives de rendement à jour, y compris le
Contrôle des pertes réelles et apparentes prévu en 2011. Une mise à jour sur le
volet Demande du programme est soumise au Rapport de 2010 sur la valorisation de
l’eau (ACS2011-ICS-ESD-0011) qui traite des progrès réalisés par le biais des
efforts de conservation de l’eau.
En 2010, le programme
de contrôle actif des fuites a permis d’éliminer environ 1 725 ML
en perte d’eau, assurant de ce fait des économies d’exploitation directes de
près de 131 000 $. L’Indice des fuites de l’infrastructure (IFI) est une
mesure de rendement clé de l’efficacité du programme de contrôle des pertes en
eau dans l’ensemble de l’industrie. En 2010, l’IFI a été calculé à 3,5, tout
juste au-dessous de notre cible optimale de 4,0 et ce, pour une troisième année
de suite. Selon les normes de l’industrie, le programme de contrôle des pertes
en eau de la Ville d’Ottawa se situe dans la catégorie « bonne ».
Incidences juridiques / concernant
la gestion des risques :
L’acceptation du présent rapport ne pose pas
d’embuches juridiques – à la gestion des risques.
Répercussions financières :
Aucune répercussion financière ne découle
actuellement du présent rapport. Les fonds nécessaires à la continuation
de la Stratégie de contrôle des pertes en eau existent sous la commande interne
d’immobilisations 902043 – Stratégie de contrôle des pertes en eau.
Consultation
publique / commentaires :
Il n’était pas nécessaire de procéder à une consultation publique.
BACKGROUND
The City of
Ottawa has been providing drinking water services to its residents for over 130
years. During this time, the demand for
drinking water has generally grown with the City’s increasing population. The drinking water infrastructure required to
provide this service has also expanded in order to meet the water demand. High quality drinking water continues to be
provided through an extensive network of infrastructure including water
purification plants, booster pumping stations, reservoirs and tanks,
watermains, hydrants and service connections.
The
original growth development strategy for the water infrastructure was to expand
the system to ensure that adequate capacity (volume and pressure) was available
to meet customer demand. However, it is also recognized that the existing
infrastructure must be utilized efficiently and effectively in order to
minimize the financial pressures and defer the need of costly plant expansions
and the installation of large diameter transmission watermains.
In
order to do so, the City has developed programs to address both the supply and
demand side of the overall water demand equation. The supply side program update will be
addressed in this report.
DISCUSSION
The
purpose of this report is to present the activities undertaken in 2010 as part
of the water loss control program and outline those initiatives that are
planned for 2011. The following is a
list of some of those initiatives currently in place or planned:
- Regular
maintenance of production and distribution system water meters;
- Chemical usage
analysis to confirm and validate production input volumes accuracy;
- Continuing night
time water use monitoring in closed pressure zones and communal well
systems to identify system leakage;
- Technical peer
review of our Standard Water Balance including an economic analysis of the
Water Loss Control program;
- Watermain
break repair response procedure review to ensure consistency and that
repairs are undertaken in a timely manner to minimize leakage run-time;
- Prioritization
of watermain rehabilitation and replacement needs based on the results of
the leak surveys;
- Continuing
leak detection surveys on local distribution and transmission watermains;
- Improved accounting
for all metered and unmetered usage and improve the methods used to
estimate unmetered usage;
- Application of
district metering areas to identify leakage for plastic pipes;
- Implementation
of Advanced Meter Infrastructure project (ACS2011-ICS-ESD-0006-IPD); and,
- Continued
enforcement of leaks on private property program.
Water
Balance Summary Report
In 2005, the City adopted the Standard Water Balance as a mechanism to determine the volume of non-revenue water. The Standard Water Balance Summary Report for 2010 is presented in Figure 1. The purpose is to account for all water usage from the time the water is treated to the point of consumption.
Figure 1: Standard Water Balance
Summary Report
|
System Input Volume 105,993 ML |
Authorized Consumption 89,157 ML |
Billed Authorized
Consumption 87,477 ML |
*Billed Metered Consumption 87,199 ML |
Revenue Water 87,477 ML |
|
|
Billed Unmetered Consumption 278 ML |
|||||
|
UnBilled Authorized
Consumption 1,680 ML |
UnBilled Metered Consumption
355 ML |
Non-Revenue Water 18,516 ML |
|||
|
UnBilled Unmetered
Consumption 1,325 ML |
|||||
|
Water Losses 16,836 ML |
Apparent Losses 1,420 ML |
UnAuthorized
Consumption 270 ML |
|||
|
Customer Meter Inaccuracies 1,150 ML |
|||||
|
Real Losses 15,416 ML |
Leakage on Transmission
& Distribution Mains |
||||
|
Leakage and Overflows at
Reservoirs |
|||||
|
Leakage on Service
Connections up to Metering Point |
|||||
* The
Billed Metered Consumption has been adjusted to reflect the effect of meter
reading lag and therefore the volume used here for Water Balance purposes does
not match the annual volume reported and billed by the Revenue Branch.
The accounting of the various volumes that are used to determine the Standard Water Balance are continually improved for accuracy based on refined data obtained through the annual initiatives.
The following sections provide performance metrics, charts and graphics which describe in greater detail the important aspects and changes in trends to these various categories.
The colour-scaled indicator strips provide best practice achievement levels of the specific Water Balance elements measured. The three colour indicators can be classified as follows:
Green - best practice activities are in place and being implemented;
Yellow - best practice activities have not been achieved; continuous improvement measures have been initiated and/or identified; and
Red - gaps exist in current water loss control activities; continuous improvement measures have not been identified; additional focus and/or resources required to identify improvements needed.
System Input Volume
Water Produced (or System Input Volume) is defined as “the total annual volume of water treated for input to water transmission lines or directly to the distribution system”.
|
|
GREEN |
Water Produced in 2010 continued a downward trend to about 106,000
ML (down 0.9 %). The
water production has steadily decreased since 2003 by 21%. |
Water production rates have declined mainly due to:
· Reduced water consumption by customers;
· Successful implementation of the Water Loss Control Strategy (reduced leakage); and
· Sustained capital infrastructure investment targeting renewal and rehabilitation of aging infrastructure
Authorized Consumption
Authorized Consumption includes those volumes of water that are authorized by the City and are either billed or unbilled.
Billed Authorized Consumption
|
|
YELLOW |
Billed Metered Consumption represents the most
significant portion of Billed Authorized
Consumption and total Authorized Consumption and for 2010 increased by
about 819 ML or 2.7%. Authorized
consumption has only decreased by about 10% since 2003. |
A detailed analysis of
the Billed Metered Consumption has not been conducted but there are a number of
contributing factors that may have combined to cause this shift in observed
declining water consumption trends.
These factors may include but are not limited to; general economic
recovery, water rate stabilization, increased in water efficient appliances,
system growth and changes in weather patterns influencing customer use.
Billed Unmetered Consumption
|
|
YELLOW |
To date, "Flusher Hydrant Usage” Program
remains the only Billed Unmetered Consumption. Hydrant Use Permit issued in 2007
– 378 2008
- 414 2009
- 411 2010
- 425 This program relies on an "Honour
System" of usage reporting as outlined in the "Guidelines for use
of Flusher Hydrants". |
Explanation for the Flusher Hydrant
Usage decrease may be that the contracted
work for the larger water hauling companies has also decreased, or all water
taking is not being reported (i.e. theft).
Further review of the program result is required.
Unbilled Authorized
Consumption
Unbilled Authorized Consumption is the sum of
both Unbilled Metered and Unbilled Unmetered Consumption and in 2010 increased
by about 2.7%, but only represented about 2% of the total Authorized
Consumption.
Unbilled Authorized Consumption includes water
used for water distribution operation and maintenance activities (flushing and
commissioning of watermains, hydrant flow testing, flushing watermains to
maintain water quality), temporary service water use, fire fighting and some service
water for City facilities such as parks, outdoor rinks, pools, splash pads and allotment
gardens.
New facilities are designed with meters incorporated into the design. There are still approximately 30 unmetered splash pads. Public Works have been systematically upgrading and metering about five (5) or six (6) of these sites per year. There are also about 100 City parks that have puddle rinks during the winter which are not metered. Only one or two pools are unmetered.
Revenue Water
Revenue Water is equal to Billed Authorized Consumption.
|
|
GREEN |
The
volume of Revenue Water in 2010 has increased by about 3% from 2009. |
It
follows that the overall change in Revenue Water volume on an annual basis
correlates highly to changes in the Billed Authorized Consumption.
Water Losses
The difference between the volume of Water Produced and the volume of Authorized Consumption is referred to as Water Loss. Water Loss is subdivided into Real and Apparent Losses. Apparent Losses are water losses due to Customer Meter Inaccuracies and Unauthorized Consumption. Real Losses are water losses through system leakage.
|
|
GREEN |
Although by volume, Apparent Losses represents only 8% of Water Losses, the revenue loss is significant at over $3.9 million* compared to $1.2 million** for Real Losses. * Based
on the 2010 combined water and sewer rate of $2.756/m3. **Based on the 2010 marginal cost of water
of $0.076/m3. |
Apparent
Losses
|
|
YELLOW |
Apparent
Losses represent a far smaller portion of the water “lost” within the system,
but it represents larger revenue potential to the City. In
2010, an analysis of apparent loss meter inaccuracy was conducted. The
estimated volume of Apparent Losses has been reduced in 2010 based on that
validation exercise. |
|
|
YELLOW |
Small
meters (15mm) account for 94% of the meter population, contributing 46% to total
billed consumption. Under-registration at 0.9% translates to 365 ML or about
$1M.* Medium meters (19mm to 50mm) account for
about 5% of the meter population, contributing 36% to total billed
consumption. Under-registration at 1.2% translates to 379 ML or about $1M.* Large Meters (75mm +) account for <1% of
the meter population, contributing 18% to total billed consumption.
Under-registration at 2.5% translates to 406 ML or about $1.1M.* |
* The
under-registration figures quoted are based on bench tests of incoming meters
in the Water Meter Lab from 1993 to 2009.
A reduction
in Apparent Losses does not necessarily lead to real financial savings. The reduction may simply be attributed to improved
accounting methods for those losses and the reallocation of volumes within the Water
Balance. If it were possible to
eliminate all Apparent Losses, the potential combined water and sewer revenue
gains would amount to approximately $3.9M[1]
for 2010.
Apparent Water Loss Control
Strategies
The water loss control strategies that are in place to reduce Apparent Losses include the following:
Reduction of Unauthorized Water Usage
Through the course of our normal service delivery, field staff will note and report instances of unauthorized water consumption such as open water meter bypass valves and unauthorized water connections upstream or ahead of the water meter.
When a bypass valve is found open or to have been opened, it is immediately closed and “sealed”. The building owner is notified of this infraction and when warranted, a fine is issued.
If an unauthorized and unmetered connection to the water system is discovered, the building owner is notified of the infraction and told to immediately remove the connection. A failure to respond immediately results in the owner risking having the water supply to the building interrupted until the correction is affected. Once the unauthorized connection is removed or properly “tied in” to record consumption, meter readings are collected and an average use is determined for the property and the Revenue Branch back-bills the customer for the previously unmetered water use.
Large Water Meter (75mm +) Maintenance and Water Meter Change-Out
Programs
Large volume services represent approximately 55% of the City’s overall water demand. Due to their significance to the overall revenue stream, an enhanced level of maintenance and service for these meters is required. Industry best practices suggest that they are to be changed out every 3 to 6 years depending on the meter size; the larger the meter the earlier the change-out. The large meter changeout program does not currently meet this objective. This will be addressed as part of the overall meter changeout program strategy to be completed by 2013, after the AMI project has been completed.
These accounts had seen a reduction in their consumption over the past few years. In 2010, consumption increased in this sector, which is consistent with the overall Billed Metered Consumption trend.
Maintenance of defective meters requires staff to enter private property. In some situations, City staff have been prevented from carrying out necessary maintenance due to cancellation of scheduled appointments and/or refusal by the private owner to grant access. This situation reduces the ability of the City to obtain accurate billed metered consumption. The City does not currently have any recourse to obtain access for this purpose. As a result, staff will be reviewing the Water By-law and developing a policy and associated by-law clause to address the enforcement of access to change water meters. Additional amendments to the by-law include provisions to enforce private plumbing repairs, which currently hamper the large meter changeout process. Proposed Water By-law revisions will be brought forward for Council consideration in early 2012.
Advanced Meter Infrastructure (AMI) Project
The contract for the supply and installation of a City-wide AMI project and the implementation period will take place over approximately 20 to 24 months (ACS2011-ICS-ESD-0006-IPD). The AMI system will replace obsolete meter reading technology and will eliminate estimated meter reading values, therefore ensuring that accurate consumption data are used for water billing and accounting purposes.
The City’s water meter replacement program has been suspended for the duration of the AMI implementation. As mentioned above, a City-wide meter change-out will occur after the deployment of AMI, using higher resolution meters. This will result in higher resolution data collection to be used to validate and improve the hydraulic model, to identify daily and hourly water use patterns and to monitor the effects of targeted water conservation measures, and to provide real consumption data to improve the identification of water losses through district metered area night-time monitoring.
Reduction of Unmetered Properties
In an effort to minimize the possibility of unmetered properties the tax and water account databases are compared at least annually when an update is received from the Municipal Property Assessment Corporation (MPAC). This measure ensures timely detection of unmetered accounts. In the rare event that an unmetered property is identified, Revenue Branch back-bills the customer for previous unmetered use once average property consumption can be determined from new meter installation readings.
Real Losses
Real Losses are water losses from the water distribution system between the point of introduction into the system and up to the point of measurement (water meter) at a customer location.
|
|
GREEN |
The Real Losses component of the Water Losses
is valued at about $1.2M per year using the 2010 marginal cost of water of
$0.076/m3. |
With a water distribution system of 2,850 km and joints every 6 to 10 meters and 2,100 km of public services, leakage must be expected. It is also important to note that a portion of the Real Losses is defined as “unavoidable background leakage” and therefore it is not economical to identify and eliminate all Real Losses.
Real Water Loss Control Strategies
The water loss control strategies that are in place to reduce Real Losses include the following:
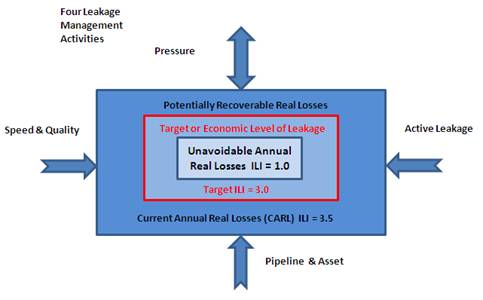
The four leakage management activities are shown on Figure 2.
Figure 2: Real Loss Control
Initiatives
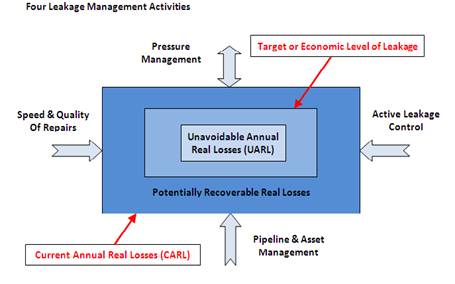
We continue to focus on the four different aspects of leakage management activities:
- Active Leak Control (which includes District Metered Areas);
- Pressure Management;
- Speed and Quality of Repairs; and
- Pipeline Asset Management.
Active Leak Control
Leaks are currently investigated either reactively (reported leaks) or proactively (leak surveys). The active leak control program is intended to locate leaks before they surface and to initiate repairs in a timely manner.
The Active Leak Control (ALC) survey of the central water distribution system and communal well systems for all metallic watermains (1,850 km) was completed in 2010. The survey identified 35 leaks on watermains, 66 leaks on service connections and 25 leaks on other appurtenances within the water distribution system.
|
|
GREEN |
|
In 2010, we realized an estimated savings of $131,000[2] by proactively identifying and repairing leaks. The total costs to implement this program in 2010 were $128,000. We will continue to utilize leak surveys in 2011 to actively detect and repair system leakage.
A continuous leakage management technology
is being piloted this year in the
Leaks on Private Property
During the course of the leak survey activity, numerous leaks were identified on water service lines on private property. These leaks on private property contribute to the City’s Real Losses and associated ILI.
To deal with these situations, the City has developed a business and customer communication program to reduce this leakage and expedite repairs to the private infrastructure. When a leak on private property is identified, the property owner is given a letter stating that a leak was found on their property and noting that they are responsible for the repair. For those property owners who do not repair their leaks, they run the risk of damage to their home and/or adjacent property.
|
|
GREEN |
The
Leak On Private Property process, started in 2008, has been very successful
and will continue to be utilized as a leakage management tool to address and
minimize private property leakage. While the chart still identifies 3 leaking
services from 2010, these services were either identified late in the year
and are currently in process, or have been granted an extension to complete
the repair. |
Leak Surveys/Condition Assessment on Large Diameter Watermains
The City operates and maintains about 200 km of large diameter watermains (610 mm and larger) within the central distribution system. The implementation of an annual Large Diameter Leak Detection program will allow the City to proactively identify leaks and schedule repairs with minimal disruption to the customers.
In 2007, a pilot project was initiated to perform leak surveys on large diameter watermains in order to evaluate the effectiveness of current and available technology. The results from this pilot and condition assessment projects conducted in 2008 and 2010 indicate there are reliable cost-effective options to conduct assessments on large diameter watermains, which are critical components of the water infrastructure.
Proposed plans to conduct additional inspections on critical transmission watermains in 2010 were deferred due to the major and concurrent watermain projects resulting from the Stimulus Projects. The needs, priorities and timing will be re-evaluated in 2011.
District Metered Areas (DMAs)
Another method of Active Leak Control is the use of District Metered Areas. In the 2008 Water Loss report, we identified that this tool is appropriate for identifying leaks in areas with non-metallic, typically PVC watermains.
In 2010, DMAs were conducted in the areas listed below.
- Bridlewood development (3W pressure zone) Ward 23
- Marchwood Lakeside development (3W pressure zone) Ward 4
- Brookside Manor development (2W pressure zone) Ward 4
- Riverside South development (2C pressure zone) Ward 22
- Fairwinds development (3W pressure zone) Ward 6
In the developments where excessive losses have been identified, we have conducted localised leak detection surveys on hydrants, valves and services and identified and repaired leaks found on public infrastructure. The results from these monitoring sessions have been very beneficial as they have confirmed that leakage in non-metallic areas of the water system can effectively be measured by this approach, allowing for cost-effective water loss reduction in newer developments. Periodic follow-up monitoring sessions that compare the rate of rise of leakage in an area using the DMA method will assist us to identify changes to the system integrity and assist in focusing the more resource intense leak detection efforts.
Pressure Management
The amount of leakage from any distribution system is directly related to the water pressure. If it is possible to reduce the operating pressure in the distribution system with little or no change in service level, leakage from the system can be reduced.
An economic analysis was completed in
2010 to determine whether pressure management would be a feasible and
cost-effective strategy for water loss control across the water distribution
system. The analysis concluded that
generally speaking, the payback period to implement pressure management in the
In the interim, we will continue to monitor and review smaller areas of the system where the watermain break frequency is high to determine if pressure management would be economically beneficial and feasible.
Speed and Quality of Repair
The speed and quality of repairs are centered on the reduction of the leakage run time. The volume of water lost in any leak is calculated as the product of the leakage flow rate multiplied by the run time. Shortening the leakage run time through earlier detection will reduce the volume of lost water. Detecting leaks before they become visible on the surface is an important means of shortening leakage run time. As noted, the Active Leak Survey program identified approximately 14% of the system failures, thereby reducing the leakage run time.
The City currently has a progressive watermain replacement and renewal capital program in place. Capital funding is allocated annually to replace watermains which have reached the end of their life-cycle based on a priority matrix comprised of many factors such as age, watermain break history, fire protection needs, and various public impacts due to failure. There are also other capital programs that aim to improve pipe condition and maximize the life-cycle duration of existing watermains through rehabilitation, such as the Structural Relining and Cathodic Protection programs.
Although difficult to estimate the contribution of individual projects to water loss reduction, the watermain replacement program and other rehabilitation programs have contributed significantly to both the maintenance of a high level of service delivery as well as the reduction of water losses or leakage in the system.
The continued capital investment in infrastructure renewal and rehabilitation helps to reduce the amount of water produced at the purification plants, and has contributed to the overall reduction in water production as observed for the last few years.
Non-Revenue Water
Non-Revenue Water is the difference between Water Produced and Revenue Water. This includes Real and Apparent Losses as well as Unbilled Authorized Consumption.
|
|
GREEN |
Non-Revenue Water represented about 17% of
the total System Input Volume in 2010. Approximately 9% of the Non-Revenue Water
was Unbilled Authorized use. |
While it is beneficial to collect revenue on the water produced, and to minimize losses which do not generate revenue, there will always be a component of Non-Revenue Water for Unbilled Authorized uses including fire-fighting and distribution system maintenance.
IWA & AWWA Performance
Indicators
Infrastructure Leakage Index (
The International Water Association (IWA) and the American Water Works Association (AWWA) have together developed a series of industry standard performance indicators based on a water system’s specific characteristics to identify the most achievable level of water loss from leakage for that system. The primary performance indicator, the Infrastructure Leakage Index (ILI) compares an estimate of current leakage to an amount of “unavoidable” leakage.
The ILI for Ottawa in 2010 was calculated at 3.5.
|
|
GREEN |
While
the ILI has remained constant over the last two years. It
is believed that the stabilization of the ILI suggests that the Real Loss
reduction initiatives have identified and repaired the “backlog” of leaks which
existed in the distribution system. To
achieve lower levels of leakage, greater efforts are required to find the
more difficult or “hidden” leaks. |
The IWA and AWWA Water Loss Control Program guidelines suggest that for
service providers that have a water source that is sufficient to meet the
long-term needs of the community and have implemented good water control
practices and effective maintenance programs, that an appropriate ILI should be
no greater than 4.0.
The City has met and surpassed this target for the past 3 years; which means that the City’s Water Loss Control program is considered to be in the industry performance status condition known as “Good”.
Other Operational Performance Indicators
|
Performance Indicators |
|
2008 |
2009 |
2010 |
|
Apparent losses - (m3/connection/year) |
|
9.2 |
13.6 |
6.7 |
|
Real losses - (m3/km of watermain/day) |
|
13.0 |
12.5 |
12.6 |
|
Mains failures (#/100 km/year) |
|
9.4 |
8.9 |
9.0 |
Water Loss Control Strategy
Leakage can never be completely eliminated from a distribution system of 2,850 km of watermains. It would also not be cost effective to attempt to do so.
As the
Figure 3 repeats the graphic of the four leakage management activities that lead to real loss control. The target and current ILI values have been added to put into perspective the real loss component in comparison to the minimum level of leakage achievable, an ILI=1.0, due to Unavoidable Annual Real Losses.
Figure 3: Target vs Current
ILI
Based on our review of the current Water Loss Control initiatives we have determined the following:
- Hydrant leak surveys are effective for detecting leaks on the metallic portion of the system and should continue to be used in those areas.
- Acoustic surveys on the non-metallic portion of the system are labour-intensive and based on field trials do not provide results commensurate with the effort.
- The application of temporary DMAs is valuable for establishing baseline leakage in areas with non-metallic infrastructure. Periodic follow-up monitoring will help to identify rate of rise of leakage in these areas for appropriate intervention.
- Pressure Management is not economically advantageous based on our low cost of water, but will be reviewed for potential implementation in smaller areas with a high frequency of watermain breaks.
- Continue to seek out, pilot and implement new leak detection technologies and improve our water balance accounting;
- Continued capital investment in infrastructure renewal and rehabilitation is critical to control real losses. By reducing these losses, the water purification plants produce less water, therefore, reducing operating costs and deferring capital investments required to expand the water purification plants and distribution system.
With a continued focus on the best practice activities that are in place and being implemented and those activities which that require continuous improvements to achieve industry best practice, we have set a new ILI target range of 3.0 to 3.2 for water loss over the next three (3) to five (5) years. This goal is realistic and can be achieved for the City’s distribution system within an economic level of intervention.
CONCLUSION
All performance indicators associated with the 2010 Water Loss Control program confirm that the City is effectively reducing water losses through the combination of various operational management activities:
· ILI has remained steady at 3.5;
·
Volume of
water captured through repairs to the water distribution system resulted
in $131,000 in savings;
·
Volume of real losses can be expressed as 199 L/service connection/day or
as 12.6 m3/km of watermain/day;
·
Revised
ILI target range to 3.0 to 3.2 over the next three to five years.
These positive improvements can be attributed to our customers and staff involvement in both the Water Efficiency Program and the Water Loss Control Strategy activities.
RURAL IMPLICATIONS
Rural villages serviced by a communal well system owned and operated by the City benefit from this program through reduced water losses in those systems.
CONSULTATION
Public consultation was not required for this update.
COMMENTS BY THE WARD COUNCILLOR(S)
This program is implemented city-wide.
LEGAL/RISK MANAGEMENT IMPLICATIONS
There are no legal/risk management impediments to receiving this report for information.
CITY STRATEGIC PLAN
The Water Loss Control program helps to achieve the City’s strategic plan for Infrastructure Renewal. The program aims to reduce overall water losses within the distribution system. By reducing these losses, the water purification plants produce less water, therefore, reducing operating costs and deferring capital investments required to expand the water purification plants and distribution system.
TECHNICAL IMPLICATIONS
There are no technical implications.
FINANCIAL IMPLICATIONS
This report has no financial implications. Funding for the continuation of the Water Loss Control program exists in capital internal order 902043 Water Loss Control program.
DISPOSITION
The Environmental Services Department will continue to implement the Water Loss Control program in 2011. Staff will prepare a summary report related to the program’s performance to Committee and Council on an annual basis.