|
|
REPORT RAPPORT |
|
|
REPORT RAPPORT |
|
DATE:
|
28 May 2012 |
|
TO/DEST:
|
Executive Director, Ottawa Police Services Board |
|
FROM/EXP:
|
Chief of Police, Ottawa Police Service |
|
SUBJECT/OBJET:
|
2012 Public Survey on Policing Services
|
RECOMMENDATION
BACKGROUND
The 2012 Public Survey on Policing Services in the City of Ottawa is the sixth in a series of formal public consultations since 1995. Similar surveys were conducted every three years between 1995 and 2008. The survey is intended to gather residents’ feedback on:
The findings from the 2012 Public Survey are a key element of the 2012 Environmental Scan and will be a key input to the development of the 2013-2015 Business Plan. Leger Marketing and Research Inc, a national leader in market research, conducted the Public Survey on behalf of the Ottawa Police Service.
DISCUSSION
The survey was conducted using a mail-to-online format, a first for the Ottawa Police Service. A total of 16,000 households were randomly selected and invited via regular mail to complete the questionnaire in either French or English through a secure online portal. The option to request a paper copy in English, French, Spanish, Arabic, Italian, German, or Cantonese was also available.
A total of 3,147 citizens participated in the survey between February 10th and April 8th 2012, representing a response rate of 20.4 percent (from 15,464 valid mail-outs). Results are deemed accurate to within a margin of error of ±1.75 percentage points, 19 times out of 20.
The 2012 Public Survey questionnaire includes new crime-specific measures that reflect changes to the community safety environment in Ottawa, questions on the awareness and use of various Police Service programs and services, and confidence with police services.
Overall, the 2012 survey returned positive results that enhance our knowledge of community priorities and identify potential opportunities for service improvement. A summary of the main findings are outlined below and in Annex A.
Perceptions of crime are most positive ever reported
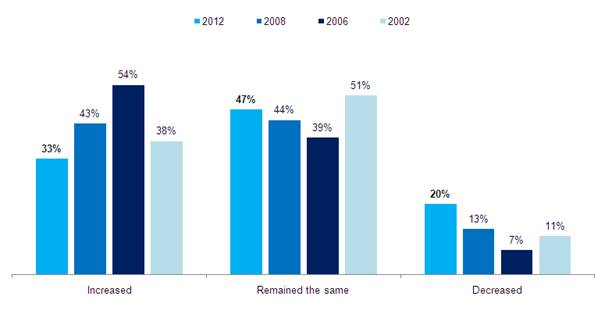
· Nearly half of Ottawa residents (47%) believe crime levels have broadly stayed the same over the past three years. Additionally, the proportion of citizens who think crime has increased is the lowest ever reported (33%), and this has improved significantly since 2006 (54%). The gap between those thinking it has increased and decreased is the smallest ever reported (13 percentage points).
· Residents are typically more concerned about crimes in the city as a whole than in their own neighbourhood.
· Ottawa residents feel safe at home, in their neighbourhood, and around the city during the day. However, residents feel less safe in public spaces and on public transit after dark.
|
Figure 1: Perceptions of Crime in the City of Ottawa
Q1 – In the past three years, do you think crime has decreased, remained the same, or increased across Ottawa? 2012: n=2,461, excluding “Don’t know” |
Views on the performance of the OPS remain very positive
· Consistent with previous surveys, satisfaction with the Ottawa Police is very high; more than four out of five residents (81%) are satisfied, with only four percent being dissatisfied.
· Satisfaction is high for those who have had direct contact with officers, whether seeing them around or having a personal interaction. These were viewed as two of the top factors in shaping perceptions of the Ottawa Police.
· In terms of public confidence in the OPS, three-in-five Ottawa residents (60%) have high or utmost confidence in the OPS, and 33 percent report moderate confidence.
|
Figure 2: Overall Satisfaction with Police Services
Q28 – Overall, how satisfied are you with the quality of the service provided by the Ottawa Police? 2012: n=2,830, excluding “Don’t know” |
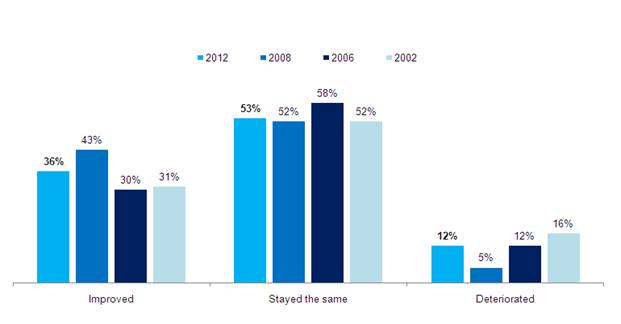
· A small majority of residents (53%) think the quality of police services has broadly stayed the same over the past three years. While more residents think the quality of policing services has improved (36%) rather than deteriorated (12%), these responses are a decline from perceptions in 2009.
· The Ottawa Police is seen to perform especially well in providing core police services:
o Responding promptly rated good or very good by 75 percent of respondents,
o Enforcing the law by 65 percent; and
o Doing everything possible to help and be of service by 63 percent.
An opportunity for improvement remains for direct local engagement (dealing with local problems rated good or very good by 49 percent, educating the public (41%), and police presence on foot or bike (35%).
Figure 3: Quality of Police Services
Q8 – Has the quality of police service in Ottawa improved, stayed the same, or deteriorated in the last 3 years? 2012: n=3,147 excluding “don’t know” |
Citizens’ concerns broadly remain the same
· Speeding cars and aggressive driving top the list of citizens’ concerns at both the city and neighbourhood level. Other top neighbourhood concerns are break and enter, vandalism, youth crime and theft from vehicles. Top city-wide concerns include drugs and youth crime. Residents are typically more concerned about crimes against property, rather than crimes against the person.
· Citizens’ concerns have remained relatively constant - all cited concerns have been in the top five lists for every OPS public survey since 2002 (and the majority since 1995).
|
Table 1: Top Five Neighbourhood Concerns, 2002 to 2012 |
|||||||
|
2012* |
2008 |
2006* |
2002 |
||||
|
Speeding cars / aggressive driving |
64% |
Speeding cars / aggressive driving |
60% |
Speeding cars / aggressive driving |
60% |
Speeding cars / aggressive driving |
65% |
|
Break & enter |
59% |
Break & enter |
51% |
Break & enter |
58% |
Break & enter |
62% |
|
Vandalism |
51% |
Theft from vehicles |
49% |
Vandalism |
53% |
Vandalism |
54% |
|
Youth crime |
50% |
Vandalism |
49% |
Theft from vehicles |
48% |
Theft from vehicles |
49% |
|
Theft from vehicles |
50% |
Identity theft |
46% |
Bicycle theft |
47% |
Bicycle theft |
42% |
|
Percentages refer to those concerned or very concerned. * weighted percentages |
|||||||
|
Table 2: Top Five City Concerns, 2002 to 2012 |
|||||||
|
2012* |
2008 |
2006* |
2002 |
||||
|
Speeding cars / aggressive driving |
76% |
Drugs |
80% |
Youth crime |
79% |
n/a |
n/a |
|
Drugs |
74% |
Youth crime |
79% |
Drugs |
75% |
n/a |
n/a |
|
Youth crime |
71% |
Speeding cars / aggressive driving |
75% |
Homelessness |
73% |
n/a |
n/a |
|
Gangs |
70% |
Robbery |
74% |
Speeding cars / aggressive driving |
72% |
n/a |
n/a |
|
Break & enter |
68% |
Homelessness |
73% |
Guns |
67% |
n/a |
n/a |
|
Percentages refer to those concerned or very concerned. * weighted percentages |
|||||||
· The most frequently suggested improvements (open text comments) related to increasing visibility of police officers, improving enforcement of traffic violations, and increasing interactions with local people.
Some police programs and services are less well known or used
· Over half of citizens (57%) are aware that the OPS has two dedicated emergency phone numbers, with 72 percent calling 911 the last time they reported an emergency. Of those who contacted the Ottawa Police in person or by phone, 78 percent were satisfied with front desk or CPC services and 87 percent expressed satisfaction with emergency and non-emergency calls.
· With the exception of Neighbourhood Watch and Crime Stoppers (72% and 71% of residents aware of respectively), crime prevention programs are not very well-known.
· Despite low levels of awareness currently, three-quarters of citizens (75%) would like to learn more about crime prevention programs and high proportions would like to know more about other OPS activities and programs.
· Over one-third of Ottawa citizens (38%) are aware of the responsibilities of the Ottawa Police Service Board.
Levels of crime victimization are relatively low, but policing challenges remain
· Just over one-in-six respondents (17%) have been a victim of crime over the past three years (comparable to previous years’ surveys, which ranged from 17-20%)
· Over half of crime victims (55%) were satisfied or very satisfied with the response, compared to 20% who dissatisfied.
· The proportion of residents that reported their most recent experience of crime to the police has increased from 70% in 2008 to 73% in 2012; however, a quarter of victims (27%) did not report crimes to the police. The main reasons for not doing so were that victims felt nothing of value was taken or damaged and/or that the police could not do anything.
Public survey findings offer insights on how to improve service delivery
Overall, the 2012 survey returned positive results, which enhances our knowledge of community priorities and identifies opportunities for service improvement. The results indicate that there has been ongoing improvement in many baseline measures compared to previous surveys, but also that each service area can be further improved. Two potential areas for improvement are further engagement with citizens at the community level and increased visibility of police in the community.
Existing Policy
The 2012 Public Survey forms part of the Ottawa Police Service’s ongoing performance monitoring to comply with Provincial Adequacy Standards for Business Planning and Ottawa Police Service Board Policy AI-001, Framework for Business Planning.
CONSULTATION
The Public Survey is the primary means of consulting the public to inform development of the Ottawa Police business plan, as has been the case for the past five business planning cycles. As the implications from the 2012 Public Survey findings are ascertained in the coming months, there will be opportunities for further consultations throughout 2012.
The Board’s Policy and Governance Committee was consulted on the 2012 Public Survey. In addition to a media release, posting on ottawapolice.ca, the Mayor and all city councillors were advised of the release and key objectives of the 2012 Public Survey on Policing Services in the event they received any questions from residents.
FINANCIAL STATEMENT
There are no immediate financial impacts or implications from the results of the public survey.
CONCLUSION
The 2012 Public Survey has engaged Ottawa residents to share their perceptions of safety and security, satisfaction and confidence with police services, and their priorities for the Ottawa Police in the future. Key findings of the 2012 survey include:
· Perceptions of crime are the best ever recorded;
· Views on the performance of OPS remain very positive;
· Citizens’ concerns broadly remain the same;
· Some police programs and services are not very well known or used;
· Levels of victimization are relatively low, but policing challenges remain; and
· Public survey findings offer insights on how to improve service delivery.
Accountability is crucial to ensure sustained improvements in our performance. The 2012 Public Survey represents the ongoing commitment of the Police Services Board and the Ottawa Police Service to building safer communities, working with the community, and continually striving to maintain the public’s confidence.
The public survey has generated a wealth of information and further analysis is underway, including an interpretation of responses at the district and ward levels. Results will be used by district staff to assist in working with community members to address crime and disorder in their neighbourhoods.
(Original signed by)
Charles Bordeleau
Chief of Police
Annex A: Executive Summary – 2012 Public Survey of Policing Services
![]()
This document contains information that reports on activities related to the Ottawa Police Business Plan.