Report to/Rapport au :
Joint Transportation
and Transit Committee
Comité conjointe des transports et
des services de transport en commun
and Council / et au Conseil
10 November 2008 / le 10 novembre 2008
Submitted by/Soumis par : Nancy Schepers, Deputy City Manager/Directrice
municipale adjointe,
Infrastructure Services and
Community Sustainability/Services d’infrastructure et Viabilité des
collectivités
Contact Person/Personne ressource : John Moser, Director/Directeur
Planning
Branch/Direction de l'urbanisme
(613)
580-2424 x 28869, John.Moser@ottawa.ca
|
|
Ref N°: ACS2008-ICS-PLA-0227
|
SUBJECT:
|
TRANSPORTATION MASTER PLAN (TMP) UPDATE, 2008
|
|
|
|
OBJET :
|
MISE À JOUR DU PLAN DIRECTEUR DES TRANSPORTS
(PDT) 2008
|
REPORT RECOMMENDATIONS
That the Joint Transportation and Transit
Committee table the following recommendations for consideration at the Joint
Transportation and Transit Committee meeting on November 19, 2008:
That the Joint Transportation and Transit
Committee recommends that City Council:
1.
Approve the 2008
Transportation Master Plan (TMP), as detailed in Document 10, including:
a.
The location of the
southern terminus of the North-South LRT service at the Riverside South Town
Centre;
b.
The addition of the
Hospital Corridor BRT;
c.
The supplementary
transit corridors as outlined in Table 4;
d.
The road projects
as outlined in Annex B of the TMP document;
e.
The phasing plans
for transit and road projects as outlined in Table 12 and Table 15.
2.
Direct staff to
prepare a submission, including any necessary studies and business plans, to
Build Canada and any other federal and provincial government grants or
programs, to seek partnership funds for Increment 1 transit projects in the
Transportation Master Plan following final budget approval.
3.
Direct staff to
undertake the following actions to initiate the implementation and mitigate
risks as outlined in the KPMG Risk Assessment (Document 8):
a.
Examine a range of
procurement options and explore any other existing and potential fiscal tools
that could be used for the top priority projects, and report back to the
appropriate Standing Committee(s) and Council in February, 2009;
b.
Expand the scope of
the Downtown Ottawa Transit Tunnel Environmental Assessment to include the LRT
extension to Tunney’s Pasture and Blair Station;
c.
Commence work
immediately on the Environmental Assessment for the Western Parkway Corridor,
subject to budget approval;
d.
Seek delegated
regulatory authority from the federal Minister of Transport, Infrastructure and
Communities.
4.
Direct staff to
include approved transit projects in the Draft 2009 Transit Capital Budget, to
be tabled in January 2009.
RECOMMANDATION DU RAPPORT
Que
le Comité mixte des transports et des services de transport en commun soumette
les recommandations suivantes pour qu’elles soient examinées à la réunion du
Comité mixte des transports et des services de transport en commun qui se
tiendra le 19 novembre 2008 :
Le
Comité mixte des transports et des services de transport en commun recommande
au Conseil municipal :
1.
L’approbation du Plan directeur des
transports (PDT) 2008, tel qu’indiqué dans le document 10, incluant :
a.
L’emplacement du terminus Sud du
service SLR Nord-Sud au centre-ville de Riverside Sud;
b.
L’ajout du couloir
TRA de l’hôpital;
c.
Les couloirs
supplémentaires de transport en commun tels qu’indiqués au tableau 4;
d.
Le réseau routier
tel qu’indiqué à l’Annexe B du PDT (document 10);
e.
Les plans
d’échelonnement des projets routiers et de transport en commun tels qu’exposés
au tableau 12 et au tableau 15.
2.
De demander au personnel qu’il
prépare une soumission, incluant tout plan d’affaires ou étude nécessaires, à
Chantiers Canada et à tout autre programme de prêts gouvernementaux fédéraux ou
provinciaux, dans le but d’obtenir des fonds de partenariat pour les projets de
transport en commun de la phase 1 du Plan directeur des transports après
l’approbation finale du budget.
3.
De demander au personnel qu’il
prépare les actions suivantes pour commencer l’exécution et réduire les risques
comme il est indiqué dans l’évaluation de risque de KPMG (document 8):
a.
Examiner une gamme
d’options d’obtention et étudier tout autre outil fiscal existant ou potentiel
pouvant être utilisé pour les projets à haute priorité, et faire un rapport au
comité permanent et au Conseil municipal en février 2009.
b.
Prolonger la portée
de l’évaluation environnementale du tunnel de transport en commun du
centre-ville d’Ottawa pour y inclure le prolongement du SLR vers le pré Tunney
et la station Blair;
c.
Commencer
immédiatement les travaux d’évaluation environnementale du couloir de la
promenade ouest, qui est sujet à l’approbation budgétaire;
d.
Demander l’approbation concernant
les exigences réglementaire du ministre fédéral des Transports.
4.
De demander au personnel d’inclure
les projets de transport en commun approuvés au budget provisoire des
immobilisations relatives au transport en commun qui doit être soumis en
janvier 2009.
EXECUTIVE SUMMARY
Assumptions and Analysis
The report
summarizes the technical work undertaken since May 2008 leading to the
development of the Transportation Master Plan (TMP) document including proposed
2031 comprehensive transit network, proposed implementation plan for transit,
road, cycling and walking projects, multi-modal transportation policies, as
well as public feedback received. The
report also responds to the motions raised in May 2008, including results of
financial risk assessment study and identifies next steps.
The strategic
directions that guided the update of the TMP centered on reducing automobile
dependency for peak-period travel. The
City’s targets are to increase walking and cycling trips by approximately 50
per cent and transit trips by about 76 per cent. As a result, automobile trips will grow by only 24 per cent.
Non-Motorized Travel
(Walking and Cycling)
The City’s
transportation vision promotes and supports highly sustainable modes of travel,
aimed at improving economic prosperity, environmental quality, and quality
living. To help achieve this vision
targets have been set out in terms of morning peak hour modal share; walking
should increase from 9.3 per cent to 10 per cent by 2031, with cycling up from
1.7 to three per cent. A significantly
larger portion of the trips originating in the Inner Area (43 per cent), where
transit and road networks are under significant pressure, is projected to be
attracted to walking and cycling modes by 2031.
In July 2008, the
Ottawa Cycling Plan, a comprehensive and detailed blueprint for expanding the
role of cycling in Ottawa, was approved by City Council fulfilling a commitment
of the 2003 TMP. Numerous updates to the
plan have taken place including, the inclusion of a new cycling network, and
improving routes to transit locations and along future rapid transit
corridors. In addition to cycling, the
City is also developing the first Ottawa Pedestrian Plan to be considered by
Council in 2009.
Transit
To enhance rapid
transit service coverage, and provide flexibility and additional choices for
transit users, a network of supplementary corridors was developed. Two categories of corridors were
established: transit intensive (at-grade, dedicated transit lanes) and transit
priority (co-ordinated priority measures applied throughout corridor). These corridors provide feeder services to
and from the rapid transit network as well as between a variety of urban destinations,
and directly serve the variety of land uses found adjacent, or in proximity to
the corridors. Some key recommendations
include Carling Avenue and Baseline Road as transit intensive corridors and
Bank Street and Rideau Street as important transit priority corridors. Table 4 lists the supplementary corridors
and the proposed service improvements.
While there is
great desire to service Orléans, Kanata and Barrhaven with light rail transit,
the required density to support light rail at their Town Centre locations will
not be reached by 2031. Until a density
threshold of 120 population and jobs/hectare is achieved, rapid transit service
to these areas will continue to be bus based.
Much of the
Riverside community is yet to be built. The City’s plan to establish Riverside
South as a transit-oriented community will require providing light rail service
early in its development to reduce the need for new roads and road widenings,
and to require development densities upfront that will be sustained throughout
the build-out period.
Rail corridors were
examined as part of the supplementary corridor analysis. Within the urban area, the locations of the
freight railway corridors do not match the existing and future population and
employment locations, as development has intentionally been directed to areas
removed from the rail tracks. Outside
Ottawa, the population and travel demand in the outlying communities are at
levels that make private commuter bus service an appropriate alternative to the
automobile. The City will work with
neighbouring municipalities and private bus companies to integrate their
transit operations, whether bus or train, with the OC Transpo system. While, within the planning horizon, the City
will focus its investment on addressing transportation problems within the urban
boundary, it will continue to purchase surplus railway rights-of-way, as they
become available, for use as future transportation corridors.
Proposed first Increment of Transit
Investment
The tunnel and the
light rail transit (LRT) from Blair to Tunney’s Pasture are required for system
capacity reasons by 2018 and should form part of the first construction
increment. The introduction of LRT will
require the construction of a rail maintenance facility in the east end. It is also recommended to include the bus
rapid transit (BRT) sections from Fallowfield to Barrhaven Town Centre and from
Moodie Drive to Bayshore to address current operational issues Baseline to
Norice section is also recommended to facilitate the development of the
Centrepointe Town Centre and the expansion of the Algonquin College. The BRT (or bus lanes) from Navan to Blair
Station score very high in the operational review and is also recommended as
part of the first priority.
Risk Assessment
As a result of
Council Motion 37/14, a financial risk assessment of the approved network plan
was conducted. Top risks associated
with the plan, including the downtown tunnel and Ottawa River Parkway corridor
were assessed. The assessment
determined that a number of risks, if left unmitigated could potentially
increase the cost of the program, for example: an uncompetitive bidding
process, the potential for elaborate scope change, the cost of inflation and
currency, and overall project staging.
The assessment
determined that the approximately $4.7 billion program cost
estimate is sound and appropriate, although it was not estimated at a
level of detail to include contingencies for all of the risks identified in the
financial risk assessment. It was
concluded that most of the risks identified through the assessment are capable
of being mitigated, provided they are addressed upfront. A number of examples of early mitigation
measure include, the completion of environmental assessments and the
acquisition of lands not currently owned by the City but needed to support
early project phasing. The risk
assessment also confirmed an appropriate first project implementation strategy
aimed at reducing potential risks.
Roads and Key Project
Recommendations
Despite the
substantial projected increase in transit usage, there will also be an increase
in demand for automobile trips.
Therefore, following the identification of the transit system
requirements to 2031, necessary to achieve a 30 per cent City-wide peak hour
transit modal split, a complementary road network to accommodate the residual
demand was identified.
The fundamental
objective that governed the identification of road implementation priorities is
to minimize road expenditure in the early years while investment in transit is
given a high priority to accelerate the shift to transit. Therefore, road projects in the first phase
were limited to new road links without which imminent planned growth cannot
occur, widening of existing arterials which have been at capacity for sometime
or roads identified as Council priorities.
Project priorities in the second and third phases were identified based
on projected future growth rates.
Draft 2008 TMP Document
There are a few
differences between the 2003 and 2008 TMP.
The updated TMP introduces a newly revamped infrastructure project list
that includes updated project phasing.
A full breakdown of changes by chapter is provided.
Financial Implications
Numerous funding
sources have been identified for the proposed rapid transit network plan
including federal and provincial gas tax, as well as development charges. Assumptions used to calculate the
City's funding availability assume that the province and federal government
will each contribute a third of the plan's funding requirement.
Growth roads are 95
per cent funded from development charges so the total of $791 million would
require City funding of $40 million
over the next 10 years.
Investment Strategy
An Investment
Strategy will be undertaken to outline how the City can secure the funds
required to build, maintain and operate the proposed transit network and to
ensure that projects stay on schedule and do not cost more than
anticipated. This strategy will first
identify financial tools that the City can leverage for potential sources of
revenue to support and enhance the rapid transit network. A financial model will then be developed to
identify the timing and magnitude of funding gaps that might arise over the
full life cycle of the investment. The
final component will be an implementation plan that clearly identifies how the
City will fund rapid transit in the short, medium and long term. A Terms of Reference for the first component
(financial tools) of the Investment Strategy is attached to this report as
Document 11. Staff will report back on
the findings of this assessment in the first half of 2009.
Public Consultation/Input
The TMP
consultation objectives have been to engage a broad range of citizens and
stakeholders in a dialogue around Ottawa’s long-term transportation
planning. In support of this objective
the City held a series of consultation sessions, public open houses, group
focus sessions, and agency group meetings.
RÉSUMÉ
Hypothèses et analyse :
Ce rapport résume les travaux techniques
qui ont été exécutés depuis mai 2008 et qui ont mené à la production du
document du Plan directeur des transports (PDT), incluant le réseau détaillé de
transport en commun projeté pour 2031, le plan d’exécution concernant le
transport en commun, les routes, le cyclisme et les sentiers, les politiques de
transport multimodales, ainsi que les remarques exprimées par le public. Le
rapport répond également aux motions soulevées en mai 2008, incluant les
résultats de l’étude sur l’évaluation des risques financiers, et se termine par
l’identification des étapes à venir.
Les orientations stratégiques qui ont
été utilisées pour la mise à jour du PDT ont le but de réduire la dépendance de
l’usage d’automobile pour les trajets de l’heure de point. Une cible de la Ville est d’augmenter par
d’environ 50 pour cent les trajets complétés à pieds ou par vélo et par 76 pour
cent pour le transport en commun. Par conséquent, les trajets en voiture
augmenteront par seulement 24 pour cent.
Transport
non motorisé (marche et cyclisme)
La vision de la Ville pour le transport
promeut et soutient les modes de transport durables qui visent à améliorer la
prospérité économique, la qualité de l’environnement et la qualité de vie des
citoyens. Pour aider à atteindre cette vision, des cibles ont été établies
concernant la part modale par heure de pointe; ainsi, la marche devrait passer
de 9,3 à 10 pour cent en 2031, et le cyclisme, de 1,7 à 3 pour cent. On prévoit
qu’une portion plus grande des déplacements provenant de la zone intérieure
(43 %), où le réseau routier et celui du transport en commun sont soumis à
de fortes pressions, se fera de plus en plus par la marche et le vélo en 2031.
En juillet 2008, le Plan sur le cyclisme
d’Ottawa, un projet détaillé visant à faire progresser la place qu’occupe le
cyclisme à Ottawa, a été approuvé par le Conseil municipal, remplissant ainsi
l’engagement du PDT de 2003. Plusieurs mises à jour du plan ont été produites,
incluant le développement d’un nouveau réseau cycliste, l’amélioration des
routes menant aux emplacements de transport en commun et le long des futurs
couloirs destinés au transport en commun rapide. En plus du cyclisme, la Ville
développe actuellement un plan de la circulation piétonnière qui doit être
examiné par le Conseil en 2009.
Transport
en commun
Pour améliorer la couverture du service
de transport en commun rapide, et offrir une plus grande flexibilité et
davantage de choix aux utilisateurs du transport en commun, un réseau de
couloirs supplémentaires a été développé. Deux catégories de couloirs ont été
établies : intensif (voies à niveau réservées au transport en commun) et
prioritaire (mesures prioritaires coordonnées appliquées dans un couloir). Ces
couloirs fournissent un meilleur accès au réseau de transport en commun rapide
ainsi qu’à une variété de destinations urbaines, en plus de desservir
directement les terres se trouvant à côté ou près des couloirs. Quelques-unes
des recommandations importantes proposent d’identifier l’avenue Carling et la
rue Baseline comme couloirs intensifs, et les rues Bank et Rideau comme
couloirs prioritaires. Le tableau 4 indique les couloirs supplémentaires et
l’amélioration proposée du service.
Même si l’on désire grandement offrir un
service de système léger sur rail dans Orléans, Kanata et Barrhaven, la densité
de population requise pour soutenir un réseau léger sur rail dans leur
centre-ville respectif ne sera pas atteinte en 2031. Tant que le seuil de
densité n’aura pas atteint 120 personnes et emplois par hectare, le transport
en commun rapide de ces endroits continuera de se faire par autobus.
La majeure partie de la communauté de
Riverside n’est pas encore construite. Le plan de la Ville pour faire de
Riverside Sud une communauté orientée vers le transport en commun exigera
l’implantation rapide du système léger sur rail pendant le développement de la
communauté; ceci est nécessaire pour réduire les besoins en nouvelles routes et
en élargissement des routes, en plus d’exiger des densités de développement qui
seront maintenues durant la période de développement.
L’étude des couloirs de système sur rail
est incluse dans l’analyse des couloirs supplémentaires. En zone urbaine, les
emplacements des couloirs dédiés au transport de marchandises par voie ferrée
ne correspondent pas aux emplacements présents et futurs des emplois et de la
population, car le développement a été intentionnellement dirigé vers les
endroits éloignés des voies ferrées. À l’extérieur d’Ottawa, la demande en
population et en déplacement dans les communautés isolées est à un niveau
faisant du service privé par autobus comme une option appropriée au lieu
d’usage de l’automobile. La Ville collaborera avec les municipalités voisines
et les compagnies d’autobus privées pour intégrer leurs opérations de transport
en commun, que ce soit par autobus ou par train, au système d’OC Transpo. En
même temps que la Ville concentrera ses investissements pour
régler les problèmes de transport à l’intérieur de ses limites, elle continuera
d’acheter des voies ferrées, à mesure qu’elles deviendront disponibles, pour
les utiliser comme futurs couloirs de transport.
Premier ajout proposé à
l’investissement en transport en commun
Le tunnel et le train léger sur rail
(TLR) allant de la rue Blair au parc Tunney deviendront essentiels pour des
raisons de capacité du système en 2018, et ils devraient faire partie du
premier ajout à la construction. L’introduction du TLR demandera la
construction d’installations d’entretien ferroviaire dans l’est de la ville. Il
est aussi recommandé d’inclure les sections de transport en commun rapide par
autobus (TCRA) de Fallowfield jusqu’au centre-ville de Barrhaven et de la
promenade Moodie jusqu’à la promenade Bayshore pour régler les préoccupations
opérationnelles actuelles. La section allant de la rue Baseline à la rue Norice
est aussi recommandée pour faciliter le développement du secteur de la
promenade Centrepointe et le développement du Collège Algonquin. Le système du TCRA (ou voies réservées)
allant de la rue Navan à la station Blair a été noté comme étant très important
dans l’examen du fonctionnement, et il est également recommandé dans la
première priorité.
Évaluation du risque
À la suite de la motion 37/14 du
Conseil, une évaluation du risque fiscal du Plan directeur des transports
approuvé a été menée. On a évalué les risques les plus élevés associés au plan,
incluant le tunnel du centre-ville et le couloir de la promenade de
l’Outaouais. L’évaluation a déterminé qu’un nombre de risques, s’ils demeurent
élevés, pourrait potentiellement faire augmenter le coût du programme. Par exemple :
un processus d’appel d’offres non compétitif, le potentiel de changement
important à l’envergure du plan, les coûts associés à l’inflation et à la
monnaie et l’élaboration globale du projet.
L’évaluation a déterminé que
l’estimation du coût du programme d’environ 4,7 milliards de dollars était
correcte et appropriée, même si elle n’a pas été effectuée en assez de détail
pour inclure les imprévus associés aux risques identifiés dans l’évaluation
fiscale. L’évaluation a conclu que la plupart des risques identifiés peuvent
être réduits s’ils sont réglés d’avance. Des exemples d’atténuation rapide des
risques incluent la réalisation d’une évaluation environnementale et
l’acquisition des terres n’appartenant pas actuellement à la Ville, mais
essentielles à la réalisation du projet. L’évaluation du risque a aussi
identifié comme souhaitable l’élaboration d’une première stratégie d’exécution
du projet visant à réduire les risques potentiels.
Recommandations
concernant les routes et autres recommandations importantes
Malgré l’augmentation considérable de
l’utilisation des transports en commun prévue, il y aura également augmentation
de la demande des trajets en voiture. Par conséquent, après avoir identifié les exigences du système de
transport en commun nécessaires pour atteindre une répartition modale vers le
transport en commun durant les heures de pointe pour l’ensemble de la ville de
30 pour cent en 2031, il apparaît nécessaire d’implanter un réseau routier
complémentaire visant à répondre à la demande des résidents.
L’objectif fondamental qui gouverne
l’identification des priorités des aménagements routiers est de minimiser les
dépenses pour les routes durant les premières années du programme, tandis que
les investissements en transport en commun seront hautement prioritaires, pour
faire en sorte d’accélérer le changement vers le transport en commun. Par
conséquent, les projets routiers de la première phase ont été limités à
l’élaboration de nouveaux liens routiers nécessaires à la croissance prévue, à
l’élargissement d’artères existantes qui sont occupées à pleine capacité depuis
un certain temps, ou encore aux rues identifiées comme prioritaires par le
Conseil. Les priorités de la deuxième et troisième phase du projet ont été
identifiées selon la croissance future prévue.
Document
provisoire du PDT 2008
Il existe quelques différences entre le
PDT 2003 et le PDT 2008. La
mise à jour du PDT introduit également une nouvelle liste de projets
d’infrastructure qui inclut une mise à jour de l’exécution du projet. Un aperçu complet des changements a été inclus dans le rapport à
l’intention des employés.
Répercussions financières
Les sources de recettes qui ont été
identifiées pour le plan du réseau de transport en commun rapide incluent le
transfert fédéral et provincial des recettes de taxe sur le carburant, et aussi
l’argent provenant des redevances d’aménagement. En faisant le calcul de
la capacité de la Ville d’entreprendre ces projets, il a été prévu que les
gouvernements fédéral et provinciaux contribueront un tiers chaque du montant
exigé par le plan.
Le financement des routes est 95 pour
cent couvert par les redevances d’aménagement, et le montant de 791 millions de
dollars nécessite une contribution de la Ville de 40 millions de dollars
pendant les prochaines dix années.
Stratégie d’investissement
Une stratégie d’investissement sera mise
en œuvre pour donner un aperçu de la façon dont la Ville peut obtenir les fonds
nécessaires pour construire, entretenir et gérer le réseau de transport en
commun proposé, et pour faire en sorte que les projets s’exécutent en temps
voulu, sans coûter plus qu’il n’a préalablement été anticipé. La stratégie
débutera par l’identification des outils financiers à la disposition de la
Ville, qui lui permettront d’obtenir les revenus nécessaires pour soutenir et
améliorer le réseau de transport en commun rapide. Un modèle financier sera
ensuite développé pour identifier les moments durant lesquels le manque de
financement pourrait survenir durant le cycle complet d’investissement ainsi
que leur ampleur. Le dernier élément sera un plan d’exécution qui identifiera
clairement comment la Ville financera le transport en commun rapide à court,
moyen et long terme. Un cadre de référence pour le premier élément (les outils
financiers) de la stratégie d’investissement est joint au présent rapport sous
le nom « Document 11 ». Le personnel présentera un rapport sur les
conclusions de cette évaluation durant la première moitié de l’année 2009.
Consultation publique /
commentaires
L’objectif de la consultation pour le
PDT est d’inviter une grande partie des citoyens et des intervenants à prendre
part à un dialogue sur la planification à long terme du transport à Ottawa. En
rapport avec cet objectif, la Ville a tenu une série de consultations, de
séances portes ouvertes, de séances de discussions, et de groupes de
consultation des organismes.
BACKGROUND
The update of the
Transportation Master Plan began in the spring of 2007 with the development of
the Transportation and Transit White Papers (discussion documents), giving
citizens the opportunity to become aware of general transportation challenges
and opportunities that Ottawa faces in the present and the future. Residents
had the opportunity to provide comments on the White Papers and any other issue
relevant to updating the Transportation Master Plan.
Throughout the fall
of 2007, a series of high-profile public consultation events on the
transportation vision with particular emphasis on transit involved reaching out
to the many voices around Ottawa by way of new and unique methods such as
Ottawa Talks Online Consultation Forum, Streeter Survey, City Café, Focus
Groups and an Interactive Workshop.
Results showed a strong support for a downtown transit tunnel and
acceptance of transfers providing service is frequent and the environment is
pleasant.
Following the
visioning exercise, surface, elevated and tunnel connections through the
downtown were assessed and only the tunnel option was deemed to be
feasible. Four network options, all with
a tunnel facility, were developed with combinations of bus and/or rail based
transit systems. Extensive consultation
on the four network options showed a strong support for tunnel through the
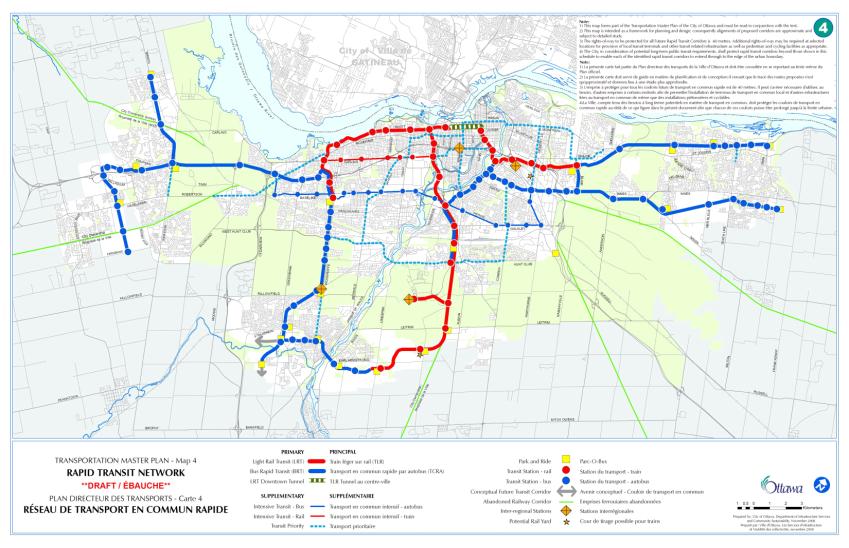
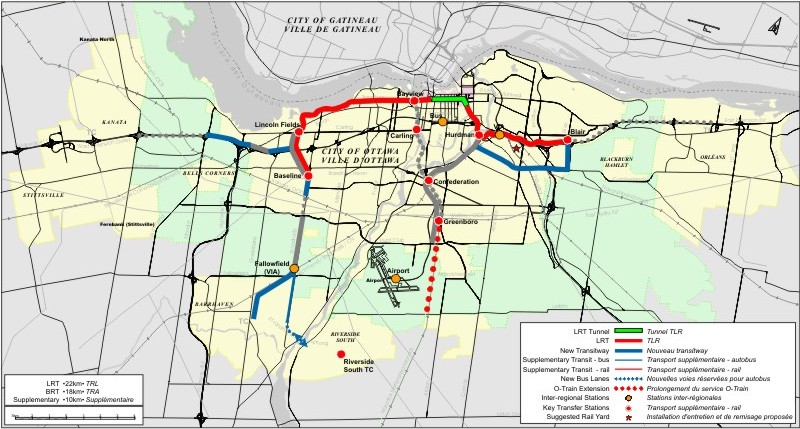
downtown. On 28 May 2008, City Council
approved a primary rapid transit network (shown in Figure 1), that is centered
on the introduction of a Light Rail Transit (LRT) tunnel running through the
downtown, along with the conversion of the existing Transitway to LRT between
Baseline and Blair Stations. It also incorporates the conversion of the
existing O‑Train to electric LRT along with its extension into Riverside
South. Extensions to the existing bus Transitway system to Orléans, Barrhaven
and Kanata are also included.
This network was
developed to address the current transit congestion in the downtown. It
provides the required capacity to serve the long-term downtown transit demand
to the 2031 horizon year, and beyond.
As directed by Council, the network also incorporates ultimate LRT
extensions to Kanata, Orléans and Barrhaven/Riverside South subject to the
following conditions:
·
Development of corridors inside the Greenbelt first
·
Business case supports return on rail investment
(ridership, capital and operating costs)
·
Achieving a minimum density target (to be determined in
the updated Official Plan)
·
Availability of funding
These corridors are identified in
Figure 1 by the red dashed lines.
Figure 1: Approved Rapid Transit Network (May 2008)
In addition to
approving the network, Council approved the following motions:
·
That staff review the option of an LRT terminus more
central to the Riverside South community as part of the staging process and
report back to Committee and Council in the fall.
·
That Council direct staff to include all proposed
streetcar corridors as detailed by the international review panel be referred
to the TMP update.
·
That Council direct staff to consider all rail
corridors as detailed in the Mayor Task Force on Transportation and report back
to Committee
This report
summarizes the technical work undertaken since May 2008 leading to the
development of the Transportation Master Plan document including the proposed
2031 comprehensive transit network, proposed implementation plan for transit,
road, cycling and walking projects, multi-modal (TMP) policies, as well as
public feedback received. The report
also responds to the motions raised in May 2008, including results of the
financial risk assessment study and identifies next steps.
DISCUSSION
The Transportation
Vision, as summarized in the 21 May 2008 report to Joint Transportation and
Transit Committees, recognizes that transportation is a means to an end -
namely, the protection and improvement of our quality of life. The following eight key strategic directions
are identified as essential to achieving that vision:
·
Creating supportive land use – Shaping development to
encourage a shift from automobile travel to walking, cycling and public transit
use.
·
Managing transportation demand – Influencing why, when,
where and how people travel
·
Managing the transportation system – Maximizing the
efficiency of infrastructure and services
·
Enhancing safety and security – Reducing the personal
risks to individuals during travel
·
Protecting the environment – Reducing the impacts of
transportation facilities and activities
·
Managing and maintaining assets – Minimizing life-cycle
costs while providing desired levels of service
·
Funding implementation – Enhancing the City’s ability
to pay the costs of this plan
·
Measuring performance – Monitoring progress toward
objectives
These strategic
directions guided the update of the TMP, including updated policies, targets
and infrastructure for specific modes (e.g. walking, cycling, transit, motor
vehicles) as outlined in subsequent sections of this report. The TMP and the Official Plan work in tandem
– transportation policies, infrastructure services and programs support the
desired land use patterns and land uses are located where transit and
transportation investments occur.
Future Travel Demand
Table 1 summarizes the current
and future growth parameters of population and employment for inside and
outside the Greenbelt, which are the key determinants of future travel demand
and need. These Council approved
population and employment projections are key building blocks for the TMP,
Infrastructure Master Plan and the Official Plan. The 2031 projections are
slightly lower than the 2021 projections on which the 2003 TMP was based.
Table 1: Base Growth Parameters Used for Travel Demand Forecast
|
Location
|
Population
|
Employment
|
|
Base Year
|
2031
|
%
Growth
|
Base Year
|
2031
|
%
Growth
|
|
Inside Greenbelt
|
533,100
|
585,800
|
+10%
|
428,600
|
505,500
|
+18%
|
|
Outside Greenbelt
|
251,900
|
433,300
|
+72%
|
71,300
|
161,300
|
+126%
|
|
Rural
|
85,700
|
116,600
|
+36%
|
21,800
|
36,200
|
+66%
|
|
TOTAL
|
870,700
|
1,135,700
|
+30%
|
521,700
|
703,000
|
+35%
|
Note: Base year: refer to 2005-2006 conditions where
Origin/Destination (O/D) survey data, employment and population data, and
traffic counts are used.
Travel demand
analysis efforts focused on the morning peak hour as it represents the time of
the day when road networks experience increased levels of congestion and is the
busiest hour for transit use. The 2031
morning peak hour travel demand forecast was determined using a computer-based long-range
transportation demand model (TRANS model). The model was recently redeveloped
to incorporate the state-of-the art modeling practices and calibrated against
the 2005 Origin-Destination Survey. The
main findings of the forecast modeling, as summarized in Table 2, include:
1. Total
travel by all modes will increase by about 38 per cent during the morning peak
hour.
2. Non-motorized
(walking and cycling) morning-peak hour trips are forecast to grow by about 50
per cent.
3. Growth
in trips by automobile during the morning peak hour is forecasted to increase
by approximately 24 per cent which is less than the rate of population growth
of 30 per cent. City-wide morning peak
hour automobile mode split will decrease from 77 per cent to 70 per cent.
4. Growth
in travel by public transit during the morning peak hour is forecasted to
increase by approximately 76 per cent. City-wide transit mode split is forecast
to increase from 23 per cent to 30 per cent by 2031.
Table 2. Growth in Travel by all Modes of Travel (Morning Peak Hour)
|
Ottawa Travel1
AM Peak Hour
|
Base Year
|
2031
|
Percentage Growth
|
|
Person Trips
|
Mode Share2
|
Mode Split3
|
Person Trips
|
Mode Share
|
Mode Split
|
|
Walking
|
20,100
|
9.3
|
|
26,800
|
9.1
|
|
34%
|
|
Cycling
|
3,600
|
1.7
|
|
8,600
|
2.9
|
|
140%
|
|
Non-Motorized (Walking/ Cycling
|
23,700
|
11%
|
-
|
35,400
|
12%
|
-
|
49%
|
|
Transit Riders
|
44,500
|
21%
|
23%
|
78,300
|
26%
|
30%
|
76%
|
|
Private Automobile Trips
|
146,600
|
68%
|
77%
|
182,300
|
62%
|
70%
|
24%
|
|
Total - All Trips
|
214,800
|
100%
|
100%
|
296,000
|
100%
|
100%
|
38%
|
1.
Includes
all travel originating from or destined to Ottawa
2.
Mode
share is the percentage of trips made by one mode, relative to total trips made
by all modes
3.
Mode
split is the percentage of trips made by one mode, relative to total trips made
by motorized modes
Non-Motorized Travel
(Walking and Cycling)
Walking and cycling
as forms of active transportation, conserve energy and reduce pressure on the
road network while preserving the environment, improving public health and
supporting economic activity. They
offer speed and convenience for shorter trips.
Virtually all trips, regardless of their principal transportation mode,
start and end with walking. All transit
trips involve walking, and a growing number involve cycling too.
A number of factors
impact on the proportion of travel that is allocated to walking and cycling
travel including land use densities, car ownership levels and household
income. Although the Official Plan
emphasizes compact, mixed-use development, together with improved on-road
walking and cycling facilities to encourage walking and cycling modes, this
will be countered by significant growth in longer trips that cannot reasonably
be made on foot or by bike.
The following
targets have also been set for the roles of walking and cycling in serving
future travel demands. These objectives
are described in terms of morning peak hour “modal share”.
·
City-wide walking modal share is targeted to increase
from 9.3 per cent in 2005 to 10 per cent in 2031.
·
The cycling modal share is targeted to increase from
1.7 per cent in 2005 to three per cent in 2031.
While the City-wide
non-motorized share of travel is forecast to grow by only one percent by 2031,
targets were kept as 10 per cent for walking and 3 per cent for cycling.
Implementation of the Ottawa Cycling Plan and the Ottawa Pedestrian Plan (when
approved), together with the Official Plan direction towards increased
intensification and density targets, make for a very supportive environment for
maintaining these targets.
Table 3 summarizes at a district
level both the current and 2031 percentage of non-motorized travel during the
a.m. peak.
·
A significantly larger portion of the trips originating
in the Inner Area (43 per cent), where transit and road networks are under
significant pressure, will be attracted to walking and cycling modes by 2031.
·
It is also noted that the number of trips destined to
the Inner Area by walking and cycling is significantly higher in magnitude than
trips that originated there which is expected of this prime destination area.
·
Within the Greenbelt, the non-motorized share of travel
(for all trips originating during the a.m. peak) is forecast to increase
from 13 per cent to 17 per cent, reducing the proportion of motorized travel to
be accommodated by transit and road systems.
Table 3: Existing and Forecast Non-Motorized (Walking and Cycling) Travel
Shares by District
|
|
District Trip Origins
|
District Trip Destinations
|
|
Base Year*
|
2031
|
Base Year*
|
2031
|
|
Total Person Trips
|
% non -motorized
|
Total Person Trips
|
% non -motorized
|
Total Person Trips
|
% non -motorized
|
Total Person Trips
|
% non -motorized
|
|
Ottawa Inner Area
|
22,600
|
35%
|
27,400
|
43%
|
47,400
|
10%
|
53,700
|
13%
|
|
Ottawa East
|
11,100
|
11%
|
11,700
|
13%
|
9,100
|
12%
|
8,900
|
13%
|
|
Beacon Hill
|
7,000
|
7%
|
9,600
|
8%
|
7,900
|
8%
|
9,700
|
10%
|
|
Alta Vista
|
16,500
|
8%
|
19,100
|
9%
|
23,400
|
8%
|
28,400
|
9%
|
|
Hunt Club
|
11,000
|
3%
|
11,600
|
3%
|
6,200
|
8%
|
8,500
|
9%
|
|
Merivale
|
17,500
|
7%
|
18,600
|
7%
|
21,100
|
9%
|
22,600
|
10%
|
|
Ottawa West
|
9,200
|
10%
|
10,900
|
13%
|
9,900
|
11%
|
11,600
|
12%
|
|
Bayshore/
Cedarview
|
16,900
|
5%
|
17,200
|
6%
|
14,800
|
9%
|
16,600
|
9%
|
|
Inside Greenbelt Subtotal
|
111,800
|
15%
|
126,100
|
19%
|
139,800
|
10%
|
160,000
|
12%
|
|
Orléans
|
21,800
|
3%
|
27,000
|
4%
|
10,700
|
8%
|
16,900
|
8%
|
|
Riverside South/
Leitrim
|
1,800
|
1%
|
9,500
|
2%
|
1,500
|
6%
|
6,100
|
7%
|
|
South Nepean
|
11,200
|
4%
|
23,000
|
4%
|
5,000
|
7%
|
16,600
|
10%
|
|
Kanata/Stittsville
|
17,800
|
5%
|
34,300
|
6%
|
15,300
|
6%
|
29,800
|
8%
|
|
Outside Greenbelt Subtotal
|
52,600
|
4%
|
93,800
|
5%
|
32,500
|
8%
|
69,400
|
9%
|
|
City of Ottawa
(Urban Area)
|
164,400
|
11%
|
219,900
|
12%
|
172,300
|
10%
|
229,400
|
11%
|
·
Base year: refer to 2005-2006 conditions where OD
survey data, employment and population data, and traffic counts are used.
In July 2008, the
Ottawa Cycling Plan, a comprehensive and detailed blueprint for expanding the
role of cycling in Ottawa, was approved by City Council fulfilling a commitment
of the 2003 TMP. The TMP document was
updated to reflect the Cycling Plan recommendations which include:
·
New Cycling Network
·
Advancing the initial implementation phase
·
Investigating a “smart bike” program and a “Park and
Bike” pilot project
·
Improving secure bike parking at key locations
including City facilities, private workplaces and multi-unit residential
building
·
Improving cycling routes to transit stops and stations,
and along future rapid transit corridors
·
Advocating more strongly the promotion and cycling
skills training through schools and CAN-BIKE courses
The City is
developing the first Ottawa Pedestrian Plan, further to a key commitment of the
2003 TMP. The plan will be considered
by Council in 2009. However, based on
preliminary recommendations, proposed changes to the TMP as they relate to the
“Pedestrian Plan” include:
·
Adopting a Pedestrian Charter
·
Creating Community Pedestrian Improvement Plans in 24
areas of Ottawa, based on facilities suggested in the Pedestrian Plan
·
Strengthening of support for pedestrian improvements
and accessibility through various planning and design processes (e.g. Community
Design Plans)
·
Revising criteria and weighting for assessing
candidates in the New Sidewalk Links program
·
Establishing “missing link” programs for non-sidewalk
pedestrian facilities
·
Adopting of new criteria for winter maintenance on
pathways
·
Providing more support for walking promotion
Since the
Pedestrian Plan is under development at the time of writing the TMP document,
the TMP document does not fully reflect its contents and will need to be
updated in the future.
Transit
Supplementary Transit Corridor Development
To enhance transit
service coverage, and provide flexibility and additional choices for transit
users, a network of supplementary corridors was developed to complement the
rapid transit network approved by Council in May 2008. The development process started with
identifying candidate corridors that link high-density trip origins and
destinations to the primary rapid transit network. Potential corridors were ranked using evaluation criteria that
are grouped into the following three major categories:
·
Ridership Potential: best reflects transit travel
demands served by the corridor including measures such as peak hour ridership,
all-day ridership as well as passenger loadings by direction
·
Ease of Implementation: focuses on specific right of
way elements which may constrain the implementation of the preferred level of
transit services within a corridor
·
Smart Growth Potential: reflects opportunities to strengthen land use density as well as
supporting sustainable modes of transportation including walking and cycling.
The following two
distinct categories of supplementary corridors are recommended to meet the
specific needs of transit users and to provide appropriate passenger carrying
capacities:
- Transit Intensive (dedicated lanes, no grade separation)
- Transit Priority (set of co-ordinated physical measures
throughout the corridor)
Transit Intensive Corridors are defined as those that demonstrate high
ridership potential that can be accommodated by providing an all-day,
dedicated, continuous exclusive transit facility for use by buses or trains,
operating at grade with priority at signalized intersections. A range of
operations can be implemented within a corridor to provide Transit Intensive
service, including:
·
At-grade LRT operating within dedicated lanes, with
signal pre-emption at intersections;
·
Dedicated all-day bus-only lanes – with or without
physical separation from general traffic (i.e. raised lanes, median, etc.).
Transit Priority Corridors are defined as those corridors equipped with a
set of co-ordinated priority measures that give transit vehicles preferential
treatment over other vehicles to minimize the impacts of traffic congestion on
transit operations within a corridor.
These measures include peak-period transit only lanes, short dedicated
lane segments, queue-jumps, and traffic signal priority.
Table 4 summarizes
the findings of the supplementary corridor analysis. Details of the development
of the Supplementary Transit Network are included in Document 1. These corridors provide feeder services to
and from the rapid transit network as well as between a variety of urban
destinations, and directly serve the variety of land uses found adjacent, or
close to the corridors.
As a result of
supplementary corridor analysis, it is recommended to add the Hospital Corridor
to the primary rapid transit network to provide direct rapid transit access
from all points on the network to the General Campus of the Ottawa Hospital,
CHEO, the University of Ottawa Health Science Campus and other adjacent land
uses, as well as serving as a catalyst to transit-oriented redevelopment of the
former National Defence Medial Centre (NDMC). BRT is recommended to provide an
opportunity for cross-town bus continuity (Kanata-Baseline Station-Baseline-SE
Transitway-Hospital-Cumberland).
Table 4: Supplementary Corridor - Proposed Transit Service
Improvement
|
Corridor Name (Limits)
|
Proposed
Transit Service Improvements
|
|
|
|
Carling
(Lincoln Fields Station to
O-Train/Carling Station)
|
At grade LRT within dedicated lanes (median
preferred)
|
|
|
Carling
(O-Train to Bronson)
|
§
Existing bus lanes, eastbound (EB) from Preston to Cambridge and
westbound (WB) from Bronson to Booth
§
Intersection modifications required at Preston and Bronson (signal
pre-emption, queue jumps)
|
|
|
Baseline/Heron
(Baseline Station to Billings
Bridge Station)
|
All day dedicated bus lanes requiring:
§
Road widening from Navaho to Prince of Wales
§
Taking away a lane of general traffic, from Prince of Wales to Data
Centre
|
|
|
Heron/Walkley
(North-South LRT to Hawthorne)
|
Dedicated bus lanes requiring road reconstruction
|
|
|
Baseline
(Bayshore Station to Baseline
Station)
|
Dedicated bus lanes requiring:
§
New exclusive corridor adjacent to Queensway-Carleton Hospital
§
Road reconstruction from the QCH to Centrepointe Drive (west)
§
Taking away a lane of general traffic in each direction, from
Centrepointe Drive (west) to Woodroffe
|
|
|
Rideau/Montréal
(Sussex to St. Laurent)
|
Peak period bus lanes with increased time of day
coverage in both directions (6am-9:30am and 2:30pm-6:30pm) by prohibiting
on-street parking during those periods
|
|
|
Montréal/Bathgate
(St Laurent to Blair Station)
|
§
Montréal Rd.: Peak period bus lanes in peak direction only (7am-9am
WB and 3:30pm-5:30pm EB) by reallocating existing traffic lanes
§
Bathgate Rd.: dedicated bus lanes
|
|
|
Bank
Street
(Wellington to Highway 417)
|
Peak period bus lanes in both directions (7am-9am
and 3:30pm-5:30pm) by prohibiting on-street parking during those periods
|
|
|
Bank
(Highway 417 to Billings Bridge Station)
|
Set of co-ordinated transit priority measures as
required (signal pre-emption, queue jumps, etc.) + parking restrictions
|
|
|
Bronson
(Carling to Catherine/ Chamberlain)
|
Set of co-ordinated transit priority measures as
required
|
|
|
Catherine
and Chamberlain/Isabella
(Bronson to Lees Station)
|
Set of co-ordinated transit priority measures as
required
|
|
|
Somerset
(O-Train crossing to Bank)
|
Set of co-ordinated transit priority measures as
required
|
|
|
Wellington
(Bank to Sussex)
|
To be determined by the Interprovincial Transit
Integration Study.
|
|
|
Hunt
Club
(Southwest Transitway to South Keys Station)
|
Set of co-ordinated transit priority measures as
required
|
|
|
Russell/St
Laurent
(Walkley to St. Laurent Station)
|
South of Innes: dedicated bus lanes requiring road
widening
North of Innes: Set of co-ordinated transit priority measures as required
(signal pre-emption, queue jumps, etc.)
|
|
|
Ogilvie
(Montréal to Blair Station)
|
Set of co-ordinated transit priority measures as
required
|
|
|
St.
Laurent
(Montréal to St. Laurent Station)
|
Set of co-ordinated transit priority measures as
required
|
|
|
Merivale
(Baseline to Hunt Club)
|
All day bus lanes in both directions requiring
localized widening
|
|
|
Merivale/Holland
(Baseline to Tunney’s Pasture
Station)
|
Peak period bus lanes in peak direction only
(7am-9am NB and 3:30pm-5:30pm SB) by reallocating existing traffic lanes on
Merivale and on-street parking on Holland
|
|
|
Richmond/Carling
(Bayshore Station to Lincoln Fields
Station)
|
Set of co-ordinated transit priority measures as
required (signal pre-emption, queue jumps, etc.) plus dedicated bus lanes
planned from Richmond / Carling intersection to Lincoln Fields Station, and
WB left turn lane for transit only at Richmond
|
|
|
Robertson/Richmond
(Westcliffe to Bayshore Station)
|
Set of co-ordinated transit priority measures as
required (signal pre-emption, queue jumps, etc.)
|
|
|
Conroy/Alta
Vista Transportation Corridor
(Hospital link to Hunt Club)
|
Bus lanes on AVTC with possible lane extension or
transit priority measures between Walkley and Hunt Club
|
|
|
Tenth
Line
(Charlemagne North to Place
d’Orléans Station)
|
Set of co-ordinated transit priority measures as
required
|
|
|
Wellington/Somerset
(Holland to O-Train crossing)
|
Set of co-ordinated transit priority measures as
required
|
|
|
Woodroffe
(Fallowfield to Strandherd)
|
Set of co-ordinated transit priority measures as
required
|
|
|
Eagleson
(Hazeldean to Eagleson Station)
|
Set of co-ordinated transit priority measures as
required
|
|
|
Hunt
Club
(South Keys to Conroy)
|
Set of co-ordinated transit priority measures as required
|
|
|
King
Edward
(Sussex to Rideau)
|
Dedicated southbound bus lanes from 2pm to 7pm
|
|
Summary of public consultation on proposed supplementary corridors
A slight majority
of people stated that they agree with the proposed Supplementary Rapid Transit Network
(51%). Approximately 25 per cent said
they disagree with it while 24 per cent indicated that they “Don’t know”. Several discussions revolved around the role
of Carling Avenue as a supplementary corridor.
Although the majority of people agreed with a streetcar concept to help
facilitate redevelopment, some people expressed the view that Carling Avenue
should be a rapid transit corridor.
Several residents within the vicinity of Browning Avenue opposed the hospital
link corridor, mainly due to concerns about the loss of greenspace and that the
corridor may create an access barrier for the community as well as potential
noise and visual intrusions.
Recommended 2031 Rapid Transit Network
Density Target in Suburban Areas to sustain LRT
Because of their
position on the rapid transit network, the Town Centres in Orléans, Kanata, and
Barrhaven are part of the Official Plan Residential Land Strategy which aims to
bring about compact mixed-use development at higher densities. The primary goal
of this strategy is to increase population and employment density to generate
additional ridership for rapid transit.
The three suburban
Town Centres (Orléans, Kanata, Barrhaven) are at different stages of their
development. Orléans’ is the most mature.
In Kanata, highrise apartment buildings are built and more are
planned. The core of the Town Centre in
Barrhaven is not yet constructed. Table
5 summarizes the Official Plan current and projected densities:
Table 5: Official Plan Current
and Projected Densities in Town Centres
|
|
2006
|
2031
|
|
Town Centres
|
Area (ha)
|
Jobs
|
Pop.
|
DENSITY
|
Jobs
|
Pop.
|
DENSITY*
|
|
Orléans TC
|
83.2
|
3,163
|
598
|
48
|
6,200
|
2,700
|
106
|
|
Kanata TC
|
229.4
|
3,818
|
2,808
|
33
|
9,300
|
6,100
|
67
|
|
Barrhaven TC
|
217.1
|
2,176
|
127
|
11
|
10,100
|
8,100
|
84
|
* Density is
expressed as People and Jobs per Gross Hectare.
The Official Plan
update is proposing that the minimum threshold required to support higher-order
transit including LRT as 120 people and jobs per gross hectare. In all cases, it is anticipated that the
amount of development in the town centres during the projection period of the
Official Plan (OP) will not allow the three Town Centres to reach the minimum
threshold density. Intensification will remain an ongoing planning goal
post-2031 at these locations. Until
this threshold is reached, rapid transit service to Barrhaven, Orléans and
Kanata would continue to be bus based.
Existing and
planned extensions to Bus Rapid Transit service to Orléans, Kanata and
Barrhaven are premised on the provision of routes that combine local service
with rapid transit service. The density targets, when they are achieved, will
permit the establishment of a hub-and-spoke system. Until then, the existence
of a BRT exclusive right-of-way allows for a transfer-free route system within
these communities that combines local and BRT service. BRT is a necessary
intermediate level of service until proposed density threshold is reached.
Riverside South is
not designated a Town Centre in the OP because its employment forecast does not
meet the criteria for a Town Centre. The City’s plan is to establish Riverside
South as a transit-oriented community will require providing light rail service
early in its development to reduce the need for new roads and road widenings,
and to require development densities upfront that will be sustained throughout
the build-out period in order to justify the investment in transit. As it
stands, Riverside South is the least accessible urban community beyond the
Greenbelt (in terms of roads and transit).
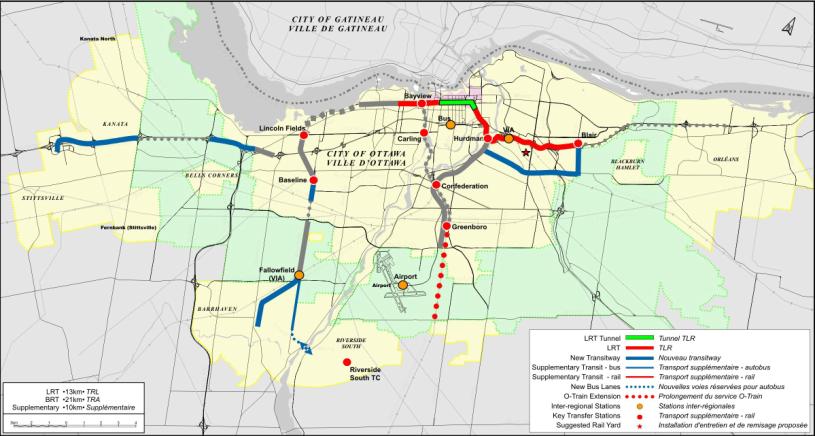
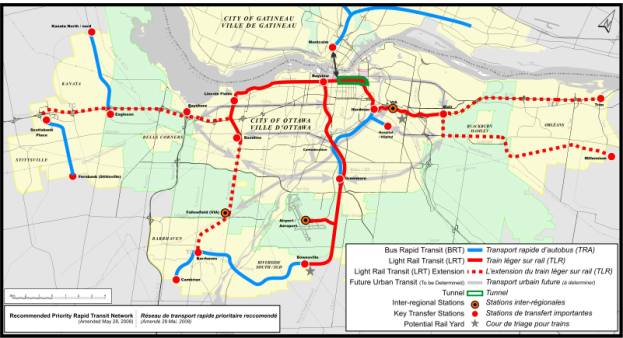
Based on the recommended
primary rapid transit network, the results of supplementary corridor analysis,
and the minimum threshold density to support LRT, the 2031 recommended rapid
transit is shown in Figure 2.
Responses to Motions Carried out at
Council Meeting on 28 May 2008:
Riverside South LRT terminus
Motion: That staff review the
option of an LRT terminus more central to the Riverside South community as part
of the staging process and report back to Committee and Council in the fall.
The Primary Rapid
Transit Network, approved by City Council on 28 May 2008, incorporated the
conversion of the existing diesel-powered O-Train service in the North-South
corridor to electrically powered LRT extending south to a terminus at
Bowesville Station. This line would continue as a bus Transitway corridor from
Bowesville Station thorough the Riverside South community and extend west to
Barrhaven Town Centre as shown in Figure 1.
The choice of Bowesville Station as the southern terminus of the LRT
service was driven by the following considerations:
·
It represented the minimum length extension beyond the
Greenbelt that would provide the level of service necessary to meet the City’s
2031 transit demands from the southern growth communities of Leitrim and
Riverside South.
·
A 3000-spot Park and Ride facility has been planned for
at Bowesville Station, which was approved as part of the North-South LRT EA
study.
·
A connection to the preferred location for a rail
maintenance and storage facility, which was also approved as part of the
North-South LRT EA study.
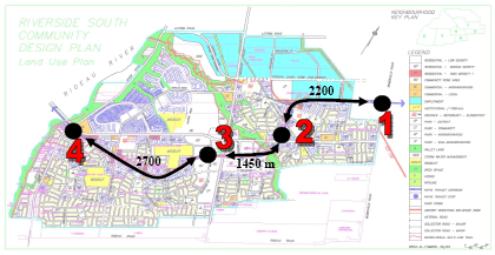
Following Council
direction, the following four stations, as illustrated in Figure 3, were
examined as possible locations for terminating the LRT:
- Bowesville Station (per approved Primary Rapid
Transit Network)
- Earl Armstrong Station (located east of the Town
Centre)
- Main Street Station (located in the Town Centre)
- Riverview Station (located west of the Town Centre)
Figure 2: 2031 Rapid Transit Network
Figure 3: Terminus Locations Considered in Riverside South
Community
Each of the four
alternative terminus locations were evaluated in terms of surrounding land
uses, ridership potential and cost.
Detailed evaluation is documented in the report entitled “Review of
Alternative LRT Terminus Locations in Riverside South” dated October 2008 (Document 2). Based on the analysis, it is recommended that Main Street
Station, located in the Town Centre, be the LRT terminus, as it provides the
best opportunity to attract additional riders and promote transit-oriented
development within the Riverside South community at an additional cost of $72M ($37M for infrastructure and $35M for extra LRT vehicles).
Streetcar Corridors
Motion: That Council direct staff
to include all proposed streetcar corridors as detailed by the international
review panel be referred to the TMP update.
The International
Peer Review Panel recommended two streetcar corridors: Carling Avenue and
Rideau/Montréal corridors. The TMP supplementary corridor analysis supports the
inclusion of Carling Avenue as a streetcar corridor for the following reasons:
·
Carling Avenue is designated as an Arterial Mainstreet
with high potentials for intense redevelopment;
·
There is high potential for all day transit demand in
both directions by 2031;
·
Population within 600m of the corridor the corridor is
expected to increase by 140 per cent by 2031, to 66,650 persons;
·
Employment within 600 metres of the corridor is
expected to increase by 100 per cent by 2031, reaching 67,900 jobs;
·
The corridor right-of-way (RoW) width is sufficient to
accommodate LRT service.
Therefore, an
at-grade LRT facility within dedicated lanes is recommended for Carling Avenue,
preferably operating in the median, connecting with the East-West LRT line at
Lincoln Fields Station and the North-South LRT line at Carling Station.
Choosing LRT technology would help in the transition toward a more dense urban
form.
For the
Rideau/Montréal corridor, the very high level of existing and future all day
transit demand in both directions would suggest implementing an exclusive
transit facility in this corridor.
However, due to physical constraints (a 23-metre to 30-metre ROW
protection for this four-lane undivided arterial), the very high general
traffic demand along this east-west arterial road, and the need for on-street
parking for local businesses, implementing an exclusive facility along the full
corridor would be a costly endeavour with high impacts. All-day bus lanes
already exist in both directions from Sussex Drive to Cumberland Street. Continued implementation of the peak-period
bus-only lanes, from Cumberland Street to St. Laurent Boulevard is recommended.
Considering that the transit demand is balanced in both directions, it is
further recommended to implement the bus-only lanes simultaneously in both
directions, with increased time of day coverage (6 am-9:30 am and 2:30 pm-6:30
pm) by prohibiting on-street parking during those periods. For the section of Montréal Road connecting
to Blair Station, peak period bus lanes in peak direction only are recommended.
Motion: That Council direct staff to
consider all rail corridors as detailed in the Mayor’s Task Force on
Transportation and report back to Committee
Rail corridors were
examined as part of the supplementary corridor analysis. Within the urban area, the locations of the
freight railway corridors do not match the existing and future population and
employment locations, as development has intentionally been directed to areas
removed from the rail tracks. This
historic reality has resulted in urban planning decisions that make it very
difficult to reach the existing rail corridors from residential and employment
areas.
The Transitway
system was developed after much of the city had taken shape and its corridors
have been developed to respond to the location of population and employment
centres. Improving service on the
Transitway corridors will result in higher ridership, less reliance on
automobile travel and a more efficient future transportation network.
In terms of using
rail corridors outside the urban area for regional-scale routes serving towns
and villages outside Ottawa, the population and travel demand in these outlying
communities are at levels that make a commuter bus service the appropriate type
of public transportation. Some of the outlying communities are on existing
intercity railway lines, and intensification of passenger rail service may be
an alternative to commuter bus service in these cases. The City will support intermunicipal travel
on public transit by providing park and ride lots connected to the rapid
transit network and by working with neighbouring municipalities and private bus
companies to integrate their transit operations, whether bus or train, with the
OC Transpo system. Within the planning
horizon, the City should focus its investment on addressing its transportation
problems, which are within the urban boundary and not in rural parts of Ottawa
nor in areas outside Ottawa.
However, the City
will continue to purchase surplus railway rights-of-way, as they become available,
for use as future transportation corridors including rapid transit network
expansions beyond the current planning horizon. Consideration will be given to also purchase sufficient lands for
potential transit stations along these corridors
Responses to Other Issues (not covered in responses to motions section)
VIA Corridor
The extension of
the O-Train and the use of the VIA Rail tracks to provide urban transit service
between Fallowfield Station and downtown, either via a transfer at Bayview or at
Train Station, was considered. The
appeal of this proposal is the availability of a track that could be upgraded
and used to provide fast connection and additional capacity to move more
commuters into and out of the downtown at a lower operating cost.
The analysis conducted indicates that while agreements can be developed
with VIA Rail and CN to use the existing passenger rail corridor out to
Fallowfield Station, there are substantial capital costs as well as risk,
approval and regulatory issues that need to be overcome. Travel time saving would be minor (between
one to three minutes) compared to using the Southwest Transitway. Operational
challenges will also limit the ability of the service to respond to ridership.
Detailed analysis of the VIA option is included in Document 3.
Western Parkway versus Carling Avenue
It should to be
noted that the term “Western Parkway” refers to a rapid transit corridor
connecting the Lincoln Fields Station to the Dominion Station, which in turn
joins the segment of the West Transitway to Bayview and downtown. Options for
this connection include the Ottawa River Parkway, the Byron Corridor and the
abandoned rail corridor. Exact
location is subject to a future Environmental Assessment Study.
The Western Parkway
Corridor and Carling Avenue serve different transit markets and complement each
other. The Western Parkway corridor,
rather than Carling Avenue, is selected to provide the rapid transit function. Carling Avenue is identified as a transit
intensive corridor with light rail running at grade, in dedicated lanes with
signal priority at intersections, connecting with the East-West LRT line at Lincoln
Fields Station and the North-South LRT line at Carling Station. A
summary of the rationale behind these selections is provided below with more
details provided in Document 4.
·
The Western Parkway corridor is the most direct link
from Lincoln Fields Station to the downtown.
Transit riders from west and southwest would enjoy a faster trip on the
Western Parkway corridor than on Carling corridor even if it is built as a
grade-separated facility (13 minutes versus 20 minutes). Using surface LRT on Carling would double
the travel time between Lincoln Field and Bayview station (13 minutes versus 26
minutes);
·
The Western Parkway corridor serves the second largest
employment centre outside of the downtown, i.e. Tunney’s Pasture/Holland Cross
employment area. The corridor also serves other important intermediate stops at
Dominion and Westboro Stations. These destinations would be missed if the rapid
transit service is relocated to Carling Avenue;
·
The Western Parkway corridor is considered the best
means to achieve the 40 per cent transit modal split goals for the recently
approved Richmond Road/Westboro Community Design Plan by providing direct
access to rapid transit service;
·
Carling Avenue corridor serves an entirely different
market – encompassing commercial, institutional and residential land uses along
its length. It is designated in the OP
as an ‘Arterial Mainstreet’ intended to encourage a range of transit-oriented
mixed land uses within a pedestrian-friendly environment. Implementation of
some form of a grade-separated rapid transit facility would be counter to the
intended pedestrian-friendly nature of a ‘Mainstreet’;
·
Implementing a costly, grade-separated rapid transit
facility along Carling Avenue, at an estimated cost of $600M, was judged to be
an inefficient use of the City’s limited financial resources since a
grade-separated facility already exists between Dominion and Bayview ($135M for
an LRT corridor on the Western Parkway between Lincoln Fields and Bayview).
·
The TMP findings are supported by the International
Peer Review Panel in their Final Report which stated that Carling Avenue is
appropriate for “Streetcar development”, operating at-grade in the median with
signal priority at intersections, to “accelerate urban regeneration in the
corridor...”.
There is a wide range of rapid transit
technologies available and they have been applied in a wide range of
situations. The technology that will be
the most appropriate for the City's rapid transit lines will be influenced in
part by the locations of the City's projects.
The selection of rapid transit technology for Ottawa should be
considered within the range of applications across the city, including the
downtown tunnel, converted Transitway segments, new lines in new areas, and
possible use on arterial streets.
Rapid transit vehicle technologies are defined
by a number of characteristics, the most important of which are:
·
Energy source and propulsion system (electricity,
diesel fuel, hybrid diesel-electric, or dual-mode)
·
Signalling and control system (manual operation versus
automated train control)
·
Degree of right-of-way separation (mixed, segregated,
fully separated)
·
Vehicle carbody type (width and length, articulated
versus single-body)
·
Vehicle floor height (low-floor at curb height versus
high-floor over vehicle systems)
Evaluation of the alternative technologies,
considering factors such as ridership demand, service characteristics, service
performance, service reliability, vehicle acquisition costs, infrastructure
construction costs, life-cycle costs, and environmental impacts will be
undertaken to recommend the technology or technologies best suited to the needs
of the City's rapid transit projects.
The results of the technology assessment and a recommended selection
will be brought forward to Committee and Council in the second quarter of 2009.
Following the selection of the preferred
technology, substantial work will still need to be done in developing technical
specifications before a specific vehicle can be selected and a fleet can be
procured.
Key Transfer Stations
The 2031 transit
network includes both BRT and LRT components that will require bus-to-rail
transfers at the following key transit stations:
·
Baseline
·
Lincoln Fields
·
Hurdman
·
Blair
The attached “Key Transfer Stations” technical report (Document 5)
provides photos and information about the above transfer stations, including the expected 2031 passenger volumes as shown in Table
6 below. The document also highlights
several existing stations of similar size and function that are currently
operating in other cities, such as the Lougheed and Surrey Central Transfer
Stations in Vancouver and Calgary’s Southland and 61st Street Transfer
Stations.
Table 6: Future 2031 Transfer
Stations (AM peak hour; 2031 ridership)
|
|
Baseline
|
Lincoln Fields
|
Hurdman
|
Blair
|
|
LRT Boarding / hr
|
1480
|
180
|
200
|
540
|
|
LRT Alighting / hr
|
1140
|
80
|
200
|
270
|
|
BRT/LRT
Transfer / hr
|
3960
|
2640
|
4700
|
8580
|
|
Bus/Bus Transfer / hr
|
980
|
1300
|
3200
|
2040
|
|
Bus Boarding / hr
|
690
|
60
|
200
|
260
|
|
Bus Alighting/hr
|
820
|
70
|
100
|
240
|
|
Total passengers serviced / hr
|
9,090
|
4,300
|
8,600
|
11,930
|
|
Bus Bays
|
6
|
8
|
6
|
10
|
|
Bus Layup Bays
|
12
|
19
|
16
|
21
|
Development of the Alternative Staging Scenarios:
Key considerations in developing Phase 1 of all staging scenarios:
Since it is not
possible to build the entire rapid transit network at the same time, four
different scenarios are developed that attempt to balance the transit
improvements in communities across the city.
For example, Phase 1 in Scenario 1 included Transitway and O-Train
improvements in the west and south with LRT construction in the east. However, there are minimum elements that are
identified as necessary for a practical first phase of all staging
scenarios. These elements are:
·
Downtown tunnel - urgently needed to expand the
capacity of the downtown core to accommodate growth;
·
Access to rail maintenance facility
·
Appropriate multi-modal transfer stations that are able
to accommodate high volume of buses and transit riders
·
Basic infrastructure to support staging and minimize
disruption to transit customers
Description of the
different phases of the four scenarios are summarized in Table 7 with the first
phase of the four scenarios illustrated as Figures 4, 5, 6 and 7.
Table 7:
Summary of Phasing Scenarios
|
Scenario
|
Phase1
|
Phase 2
|
Phase 3
|
|
1. Tunnel and LRT East
|
LRT
·
Blair - Tunney’s
Pasture
·
St. Laurent Rail Yard
Transitway
·
Hospital link (Lycée
Claudel - Innes)
·
Blair (Blair Station -
Innes)
·
West (Eagleson –
Scotiabank Place)
O-Train Extension (Greenboro
– Leitrim)
|
LRT
·
Tunney’s
Pasture-Baseline
Transitway
·
West (Lincoln Fields –
Pinecrest)
·
Cumberland (Navan -
Millennium)
·
Innes Road/Blackburn to
Cumberland Transitway.
Supplementary transit
·
Baseline (Baseline -
Confederation)
|
LRT
·
North-South link
including Airport
·
Bowesville LRT Yard
Transitway
·
Southwest (Norice -
Hunt Club if required)
Supplementary transit
·
Carling LRT
·
Heron, Walkley, Russell
and St. Laurent South
·
Baseline (Bayshore -
Baseline)
|
|
2. Tunnel and LRT West
|
LRT
·
Baseline - St. Laurent
·
St. Laurent Rail Yard
Transitway
·
West (Pinecrest -
Lincoln Fields)
·
Hospital link (Lycée
Claudel - Innes)
·
Blair (Blair Station -
Innes)
·
Cumberland (Navan -
Millennium)
·
Innes Road/Blackburn to
Cumberland Transitway
O-Train Extension (Greenboro
– Leitrim)
|
LRT
·
St. Laurent - Blair
Transitway
·
West (Eagleson -
Scotiabank Place)
Supplementary transit
·
Baseline (Baseline -
Confederation)
|
LRT
·
North-South link
including Airport
Transitway
·
Southwest (Norice -
Hunt Club if required)
Supplementary transit
·
Carling LRT
·
Baseline (Baseline -
Bayshore)
·
Heron, Walkley, Russell
and St. Laurent South
|
|
3. Tunnel and LRT East and
South
|
LRT
·
Blair - Tunney’s
Pasture
·
North-South link
including Airport
·
LRT yard at Bowesville
Transitway
·
West (Eagleson -
Scotiabank Place)
·
Cumberland (Navan -
Millennium)
·
Hospital link (Lycée
Claudel - Innes)
·
Blair (Blair Station -
Innes)
·
Innes Road/Blackburn to
Cumberland Transitway.
|
LRT
·
Tunney’s Pasture to
Baseline
Transitway
·
West( Lincoln Fields -
Pinecrest)
Supplementary transit
·
Baseline (Baseline -
Confederation)
|
Transitway
·
Southwest (Norice -
Hunt Club if required)
Supplementary transit
·
Carling LRT
·
Heron, Walkley, Russell
and St. Laurent South
·
Baseline (Baseline -
Bayshore)
|
|
Scenario
|
Phase1
|
Phase 2
|
Phase 3
|
|
Scenario 4
Tunnel and LRT East and West
|
LRT
·
Blair to Baseline
·
LRT yard at St. Laurent
Transitway
·
Hospital link (Lycée
Claudel - Innes)
·
Blair (Blair Station -
Innes)
·
West (Pinecrest -
Lincoln Fields)
O-Train extension (Greenboro
– Leitrim)
|
Transitway
·
West (Eagleson -
Scotiabank Place)
·
Cumberland (Navan -
Millennium)
·
Innes Road/Blackburn to
Cumberland Transitway.
Supplementary transit
·
Baseline (Baseline -
Confederation)
|
LRT
·
North-South link
including Airport
·
Bowesville LRT yard
Transitway
·
Southwest (Norice -
Hunt Club if required)
Supplementary transit
·
Carling LRT
·
Heron, Walkley, Russell
and St. Laurent South
·
Baseline (Baseline -
Bayshore)
|
Notes:
- Phase 1 of all
scenarios include SW Transitway links from Baseline to Norris and from
Fallowfield to Barrhaven Town Centres as well as West Transitway section
between Bayshore and Moodie.
- Phase 4 of each
scenario is the same: it sees rapid transit services extended further into
Kanata North, Stittsville, Orléans North, and Barrhaven South
The four scenarios summarized in the previous table would all result in
the same transit system by 2031. However, the different
phasing for the scenarios means that each phasing provides a different level of
benefit, has different costs
and different levels of risk associated with it. A detailed summary of the
costs, implications, risks and benefits for each phase of each scenario is
provided as Appendix A of Document 4 entitled Phasing of TMP Transit Network.
Evaluation of the Alternative Staging Scenarios
Since the four scenarios would all result in the same transit system by
2031, the approach that has been
taken is to base the evaluation of these scenarios on Phase 1 to determine
which one accomplishes the City’s objectives first. The evaluation criteria used, as listed in Table 8, are grouped
into eight major categories:
- Ridership
- Cost effectiveness
- Benefit to customers
- Benefit to the environment
- Reduces downtown bus congestion
- Supports a compact transit city
- Ease of implementation
- Approved Council direction
Detailed description and estimates of the evaluation criteria are
included in Appendices B and C of Document 6 (Phasing of TMP Transit Network). It
is important to note that these estimates were developed based on broad
assumptions to provide a basis for comparing the four scenarios and their
absolute values should not be used for more detailed analysis.
Table 8:
Evaluation Criteria
|
Category
|
Objective
|
Criteria
|
|
Ridership
|
To achieve
early growth in ridership
|
·
Estimate
of total system ridership
|
|
Cost
effectiveness
|
To maximize
the number of passenger-kilometres served for the investments in capital and
operating dollars.
|
·
Capital
Cost per passenger-km
·
Operating
Cost per passenger-km
·
Operating Cost Savings
|
|
Benefit to
Customers
|
To create an
efficient, convenient, reliable and comfortable transit system
|
·
Travel
Time Savings
·
Increased
Reliability
·
Quality
of Ride
·
Convenient
Access to Rapid Transit
|
|
Benefit to
the Environment
|
To minimize
negative impacts on the environment
|
·
GHG
reductions from transit system (CO2)
·
Emission
reductions from transit system (PM)
|
|
Reduction of
Downtown Congestion
|
To reduce
downtown traffic congestion and impact of buses
|
·
Buses
removed from Albert and Slater
|
|
Supports a
Compact Transit City
|
To maximize
the potential of the transit infrastructure to encourage transit-supportive
development
|
·
Number of
mix use centres and key employment / commercial areas served by rapid transit
·
Number of
key sites with potential for development or intensification
·
Percentage
of new Phase 1 Rapid Transit Infrastructure located inside greenbelt
|
|
Ease of
Implementation
|
To expedite
implementation while minimizing disruptions to customers
|
·
Early LRT
implementation
·
Length of
BRT network that can be implemented before tunnel
·
Degree of
change to current services during construction
·
Availability
of a Rail Yard
|
|
Approved
Council directions
|
To fulfill
Council’s direction regarding rapid transit infrastructure
|
·
Completion
of the Transitway by 2015
·
Construction
of the downtown tunnel
·
Implementation
of rapid transit using the Cumberland Transitway alignment
·
Implementation
of the LRT to the South-eastern growth area
·
Improvement
in revenue/cost ratio
|
The estimates and summary of the evaluation criteria for the four
scenarios are shown in Tables 9 and 10.
Table 9:
Evaluation of Phasing Scenarios
|
Evaluation Criteria
|
Scenario
|
|
1
LRT East
|
2
LRT West
|
3
LRT East
and South
|
4
LRT East
and West
|
|
Ridership
|
|
System ridership estimate
|
131 M
|
137 M
|
147 M
|
152 M
|
|
Cost
Effectiveness
|
|
Capital Cost per passenger-km
|
$0.49
|
$0.36
|
$0.44
|
$0.29
|
|
Operating cost per passenger-km
|
$0.27
|
$0.25
|
$0.23
|
$0.21
|
|
Operating cost savings
|
$ 375 M
|
$ 430 M
|
$ 563 M
|
$ 810 M
|
|
Benefit to Customers
|
|
Travel Time Savings (hours)
|
13.2
|
11.6
|
14.5
|
14.4
|
|
Increased Reliability
|
18%
|
25%
|
23%
|
32%
|
|
Quality of Ride
|
11%
|
17%
|
13%
|
25%
|
|
Convenient Access
|
15
|
14
|
29
|
11
|
|
Benefit to the
Environment
|
|
GHG reductions from transit system
(Tonnes of CO2)
|
153,000
|
202,000
|
213,000
|
306,000
|
|
Emission reductions from transit system
(Tonnes of particulate matter)
|
20
|
28
|
29
|
40
|
|
Reduces
Downtown Bus Congestion
|
|
Buses removed from Albert / Slater
|
40%
|
20%
|
45%
|
90%
|
|
Supports
a Compact Transit City (Smart Growth)
|
|
Number of mixed-use centres and key
employment/ commercial areas served by Rapid Transit infrastructure
|
17
|
20
|
26
|
20
|
|
Number of key sites with potential for
development or intensification
|
18
|
13
|
27
|
20
|
|
Percentage of new Phase 1 Rapid Transit
infrastructure (length) located inside the Greenbelt
|
66%
|
55%
|
44%
|
84%
|
|
|
|
|
|
|
|
|
|
|
|
|
|
|
|
|
|
|
|
Ease
of Implementation
|
|
Early LRT implementation
|
O-Train
Bayview to Leitrim
|
O-Train
Bayview to Leitrim
|
LRT
Bayview to Riverside TC
|
O-Train
Bayview to Leitrim
|
|
Length (in km) of BRT network that can
be implemented before tunnel implementation
|
20.7
|
24.1
|
34.0
|
17.1
|
|
Degree of change to current service during
construction
|
bypass of VIA and St. Laurent during
conversion
|
bypass of VIA and St. Laurent during
conversion
|
bypass of VIA, St. Laurent and O-Train
Shutdown
|
bypass of VIA and St Laurent during
conversion
|
|
Availability of rail yard
|
No approved site
|
No approved site
|
Approved at Bowesville
|
No approved site
|
|
Approved
Council Direction
|
|
Completion of the Transitway by 2015 (%
of remaining Transitway implemented)
|
33%
|
38%
|
54%
|
27%
|
|
Construction of the downtown transit
tunnel
|
ü
|
ü
|
ü
|
ü
|
|
Implementation of Rapid Transit using
the Cumberland Transitway alignment
|
x
|
ü
|
ü
|
x
|
|
Implementation of the LRT to the
South-eastern growth area
|
x
|
x
|
ü
|
x
|
|
Improvement in revenue/cost ratio to
achieve 50/50 split
|
-3%
|
+3%
|
+5%
|
+10%
|
Note: estimates are based on 2031
planning horizon.
Table 10:
Summary of Phase 1 Evaluation
|
Evaluation Category
|
Scenario
|
|
1
|
2
|
3
|
4
|
|
LRT
East
|
LRT
West
|
LRT
East and South
|
LRT
East and West
|
|
Ridership
|
 
|
 
|
 
|
 
|
|
Cost
Effectiveness
|
 
|
 
|
 
|
 
|
|
Benefit
to Customers
|
 
|
 
|
 
|
 
|
|
Benefit
to the Environment
|
 
|
 
|
 
|
 
|
|
Reduces
Downtown Bus Congestion
|
 
|
 
|
 
|
 
|
|
Supports
a Compact Transit City
|
 
|
 
|
 
|
 
|
|
Ease
of Implementation
|
 
|
 
|
 
|
 
|
|
Approved
Council Direction
|
 
|
 
|
 
|
 
|
|
|
|
|
|
|


Achieves Few Objectives Achieves Some Objectives Achieves More
Objectives
Summary of public feedback on rapid transit implementation
1) In
terms of evaluation criteria, most people selected ‘Ridership’ (21 per cent) as
the most important evaluation criterion to assess the transit scenarios,
closely followed by ‘Benefits to the Customers’ (19 percent), ‘Benefits to the
Environment’ (18 per cent), ‘Cost Effectiveness’ (17 per cent), ‘Reduction of
Downtown Bus Congestion’ (15 per cent), ‘Support a Compact City’ (6 per cent)
and ‘Ease of Implementation (4 per cent).
No one selected “Adherence to Council Directions’ as an important transit
scenario evaluation criterion.
2) In
terms of preferred implementation scenarios, although the majority of written
submissions indicated a preference for Scenario 4 (58%) followed by Scenario 3
(22%), many people indicated a preference for having both together. This was evident in the many discussion
groups, agency meetings and focus group sessions where participants had more
flexibility to articulate their preferences compared to the structured format
of the comment sheet that was used to gather written submissions. Similarly, although significantly fewer
written submissions supported Scenario 1 (10%) many people mentioned that
Scenario 1 is a logical first step before completing Scenarios 3 or 4. Very few people indicated Scenario 2 (5%) as
their preferred scenario, while a small number did not favour any of the
proposed scenarios (5%).
Operational Analysis
Building on the technical evaluation and feedback received from the
public, further analysis was undertaken to evaluate the operational benefits of
the various sections of the rapid transit network (Document 7). The objective of the analysis is to help
select the best combination of transit projects to form phase 1 of the rapid
transit implementation. The operational
review focused on the operating cost saving (representing return on investment)
and benefits to customers from the capital investment in each section. Summary of the analysis is shown in Table
11. The higher the values of return on
investment and benefit to customers, the better the performance of the section.
Table 11: Summary of Return on Investment and Benefits to Customers from the
capital investment in the various sections of the rapid transit network.
|
Section
|
Capital Cost ($M)
|
Operating Savings ($M)
|
Operation. Saving / Capital
Cost (x100)
|
Performance/ Investment
(Passenger
KM / Capital Cost)
|
|
LRT
Blair –
Tunney's Pasture
|
227
|
9.6
|
4.3
|
1.31
|
|
LRT
Tunney's
Pasture – Baseline
|
194
|
5
|
2.6
|
0.9
|
|
LRT
Bayview
– Riverside South TC
|
423
|
4
|
1.0
|
0.22
|
|
LRT
Airport
Connection
|
75
|
increase
0.8
|
N/A
|
0.01
|
|
O-Train
Greenboro
– Leitrim
|
45
|
increase
0.2
|
N/A
|
0.11
|
|
BRT
Southwest Transitway, Fallowfield – Barrhaven TC
|
46
|
1.7
|
3.7
|
0.47
|
|
BRT
Southwest Transitway, Baseline – Norice
|
185
|
0.5
|
0.3
|
0.05
|
|
BRT
Hospital Transitway, Lycée Claudel – Blair/Innes
|
88
|
3.7
|
4.3
|
0.47
|
|
BRT
Cumberland Transitway, Navan – Millennium
|
64
|
3.3
|
5.2
|
0.38
|
|
Blackburn
Bypass Bus Lanes, Blair/Innes - Navan
|
20
|
2
|
9.9
|
2.61
|
|
BRT West
Transitway, Southwest – Pinecrest Transitway
|
171
|
2.7
|
1.6
|
0.15
|
|
BRT West
Transitway,
Bayshore
– Moodie
|
18
|
1.9
|
10.7
|
1.65
|
|
BRT West
Transitway, Eagleson – Scotiabank Pace
|
79
|
0.7
|
0.9
|
0.16
|
* Ridership levels on parallel facilities
are sensitive to transit planning decisions
Further Examination of Scenario 3 an 4 Corridors and Phasing
Recommendations
Examining
the results of the evaluation criteria, operational review and public feedback,
it was clear that phases 1 of both Scenarios 3 and 4 have merits. The two scenarios were examined closely and
the following points can be made:
1. LRT
from Blair to Tunney’s Pasture is common to both scenarios and ranks very high
in terms of both return on investment and passenger benefits. It is also
required to be in place by 2018 to avoid restricting the capacity of the
transit network. It is recommended
for inclusion in Phase 1.
2. The
Hospital Link BRT is common to both scenarios and in addition to providing high
quality service to the Ottawa Hospital campus; it was selected to provide an
alternative Transitway route between Blair and Hurdman Station during the
conversion of the East Transitway to rail.
However, recent discussion with MTO indicated that arrangement could be
made to use the additional lanes of the Queensway, to be built in the next few
years, on a temporary basis for transit during the conversion. Therefore, the timing for this project could
be deferred to Phase 2 to coincide with the future redevelopment of the
former National Defence Medical Centre (NDMC) lands.
3. LRT
from Tunny’s Pasture to Baseline Station has a high benefit to customers and is
needed to remove the majority of the remaining buses on Albert and Slater,
which takes full advantage of the tunnel investment. Even recognizing potential timing constraints associated with
planning work and obtaining required approval, this section is recommended
for inclusion in Phase 1.
4. The
West Transitway from Pinecrest to the Southwest Transitway (shown only as a
phase 1 in Scenario 4), due to its high cost, ranks low in terms of both return
on investment and passenger benefits. For this reason it is recommended for
deferral to Phase 2.
5. The
O-Train extension from Greenboro to Leitrim (shown only as a phase 1 in
Scenario 4) ranks low in terms of passenger benefits and will yield an increase
in operating cost. Therefore, it is not recommended for implementation.
6. The
Conversion of the O-Train to LRT and extending it to Riverside South (shown
only as a phase 1 in Scenario 3) has a better passenger benefit than the
O-Train extension and completes the LRT component of the rapid transit
network. Therefore it is recommended
for inclusion in Phase 1. An LRT
link to the airport ranks low in terms of both return on investment and
passenger benefits and is recommended for deferral to Phase 2.
7. Cumberland
Transitway between Navan to Millennium ranks high in terms of return of
investment and therefore it recommended for inclusion in Phase 1.
8. Innes
Road/Blackburn from Navan to Blair Station scores very high in the operational
review and is recommended for inclusion in Phase 1.
9. West
Transitway from Bayshore to Moodie is the highest performing corridor in terms
of return on investment and the second highest in terms of benefits to
customers. Therefore, it is recommended for inclusion in Phase 1.
10. West
Transitway from Eagleson to Scotiabank Place and Southwest Transitway from
Fallowfield to Barrhaven Town Centre will help the development of
transit-oriented developments. Southwest Transitway extension will help resolve
the Park and Ride congestion at Fallowfield by providing high-quality service
to the Strandherd Park and Ride Lot. Both sections are recommended to be
included in Phase 1.
11. Southwest
Transitway from Baseline to Norris: although it does not score high in the
operational review, it will act as a catalyst to facilitate the development of
the Centrepointe Town Centre and the expansion of the Algonquin College and
therefore it is recommended for inclusion in Phase 1.
12. The
remaining Transitway extensions and transit-intensive corridors are recommended
for inclusion in Phase 2.
Based
on the above points, staff recommended Phases 1 and 2 for implementation are
shown in Figures 8 and 12. Phase 1
projects balance the need for efficient system with strategic city-building
objectives.
Given
the cost of Phase 1 ($3B), and to provide realistic investment packages, it is
proposed that Phase 1 be implemented incrementally as follows:
Increment 1
Both
the tunnel and the LRT from Blair to Tunney’s Pasture are required for system
capacity reasons by 2018 and these should, therefore, both be included in the
first construction increment.
The
introduction of LRT will require the construction of a rail maintenance
facility in the east end. A new bridge
over Rideau River and Lees Avenue (Nicholas Connection) will be required from
Hurdman to Nicholas to provide continuous Transitway service from the Southeast
Transitway to downtown during the conversion of the East Transitway to LRT.
It
is also recommended to include in Wave 1 the BRT sections from Fallowfield to
Barrhaven Town Centre and from Moodie Drive to Bayshore to address current
operational concerns. Although the BRT
section from Baseline to Norice does not score high in the operational review,
it is seen as a catalyst the development of the Centrepointe Town Centre and
the expansion of the Algonquin College.
The
BRT (or bus lanes) from Navan to Blair Station score very
high in the operational review and is recommended to be included in the first
wave.
Increment 2
The
LRT from Tunney’s Pasture to Baseline Station is recommended be built as the
next priority to fully address the downtown bus congestion. It scores high in
the overall evaluation and the operational review. Only the section of the N-S LRT from Bayview to South Keys is
recommended in this wave since it provides a catalyst for development
opportunities that were identified as part of the North-South LRT project.
These include development at Carleton University, Walkley Road and Gladstone
Avenue. Building the LRT south from Bayview would also allow the development of
the area in the vicinity of Bayview Station to move ahead with Bayview in its
final configuration. Converting the O-Train to LRT in early phases avoids
disruption of service to a greater number of transit riders than if it were to
be left to later phases.
This
increment sees the completion of the rail network inside the Greenbelt and is
consistent with the International Peer Review recommendations.
Increment 3
Will include the extension of the N-S LRT to
Riverside South to help shape development in this area. At this stage, the extension does not
include an airport connection. This
increment will also include BRT extension to Orléans and Kanata (Cumberland Twy
from Navan to Millennium and West Twy from Eagleson to Scotia Bank Place)
The
Cumberland Transitway scores high in the operational review and also should be
considered as a part of this increment.
A
summary of the proposed implementation priority is summarized in Table 12 and
illustrated as Figures 8, 9, 10, 11, and 12.
Table 12: Summary of proposed implementation Priority
Phase #
|
Increment #
|
Sections
included
|
Cost ($M)
|
|
Phase 1
|
Increment 1
|
LRT
·
Tunnel
·
Blair –
Tunney’s Pasture
·
Rail yard
·
LRT
Vehicles
|
600
227
100
390
|
|
BRT
·
Fallowfield
to Strandherd
·
Baseline
– Norice
·
Bayshore
– Moodie
·
Blair –
Innes Road
·
Innes
Road/Blackburn to Cumberland Transitway
|
46
185
18
24
20
|
|
Supplementary
·
Strandherd
Drive – Rideau River to Woodroffe Park and Ride (includes bus lanes on Strandherd/Armstrong bridge)
·
Woodroffe
Avenue – transit priority measures from Woodroffe Park and Ride to
Fallowfield Park and Ride
|
28
2
|
|
Other
·
Nicholas
Connection (new bridge over Rideau
River and Lees Avenue)
|
40
|
|
TOTAL
|
1,680
|
|
Increment 2
|
LRT
·
Tunney’s
Pasture – Baseline
·
Bayview –
South Keys
·
LRT
Vehicles
|
194
250
500
|
|
TOTAL
|
944
|
|
Increment 3
|
LRT
·
South
Keys – Riverside South Town Centre
·
LRT
Vehicles
|
173
90
|
|
BRT
·
Navan -
Millennium
·
Eagleson
– Scotiabank Place
|
64
79
|
|
TOTAL
|
406
|
|
TOTAL
Phase 1
|
|
3,030
|
|
Phase 2
|
|
LRT
·
Airport
Connection
·
2nd
Rail Yard
|
75
100
|
|
BRT
·
Lincoln
Fields – Pinecrest
·
Norice to
Hunt Club
·
Eagleson
– Klondike
·
Scotiabank
Place - Fernbank
·
Riverside
South TC - Barrhaven TC
·
Barrhaven
TC - Cambrian
·
Lycée
Claudel - Innes/Blair
·
Place
D’Orléans - Trim
|
171
79
53
35
71
24
88
107
|
|
Supplementary
·
Carling
LRT
·
LRT
Vehicles
·
Baseline
(Bayshore - Baseline)
·
Baseline
(Baseline - Confederation)
·
Heron,
Walkley, Russell and St Laurent South
|
250
75
36
90
65
|
|
TOTAL
Phase 2
|
|
1,319
|
|
As Needed
|
Buses Required
|
·
2 Bus
Maintenance Facilities @ $60M each
·
Bus
Vehicles
|
120
378
|
|
Transit Priority
|
·
See
report entitled “Development of the Supplementary Transit Network” October
2008
|
260
|
|
Total
|
|
5,107
|
Figure 8:
Recommended Transit Infrastructure - Phase 1

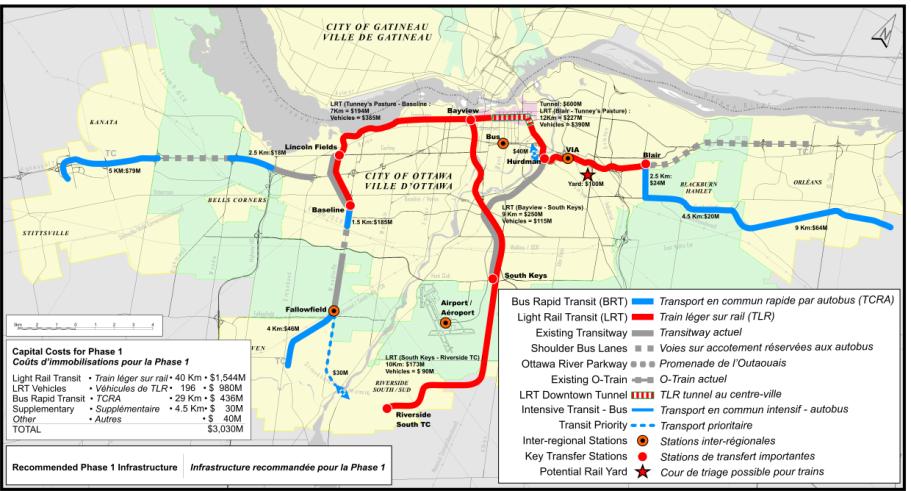
Figures
9: Recommended Transit Infrastructure - Phase 1: Increment 1

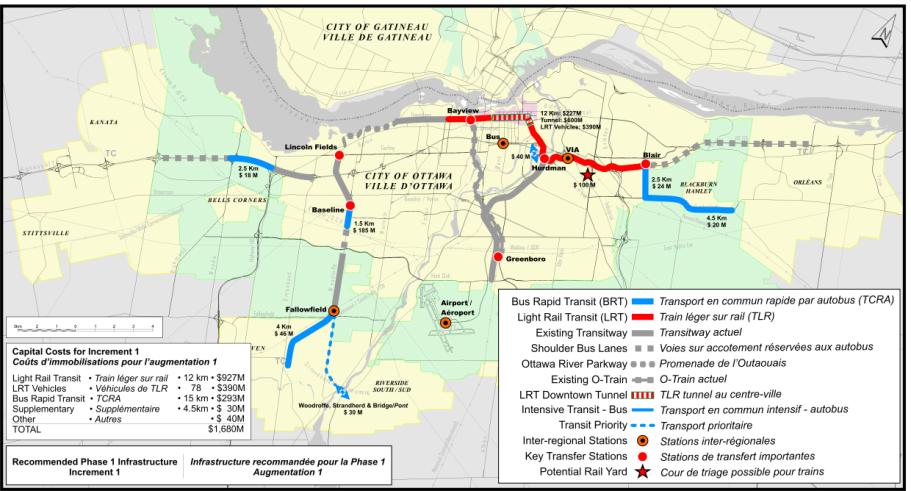
Figures 10: – Recommended Transit Infrastructure -
Phase 1: Increment 2

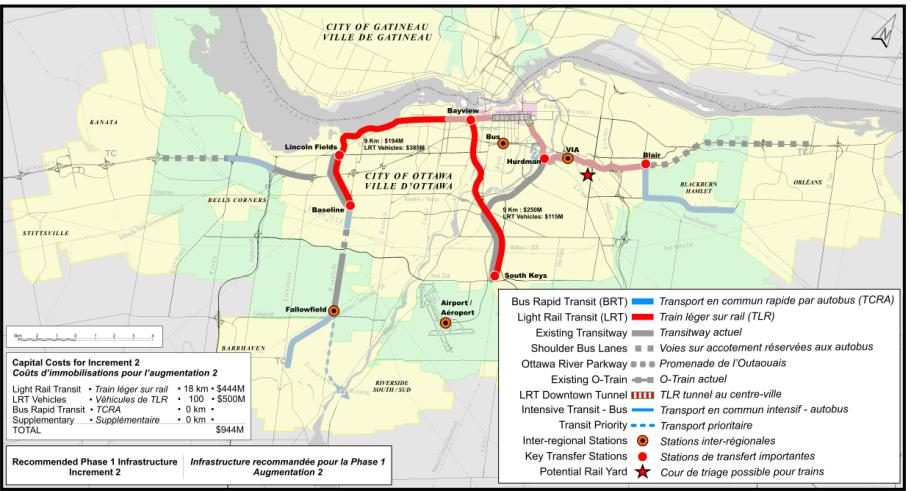
Figures 11: – Recommended Transit Infrastructure -
Phase 1: Increment 3

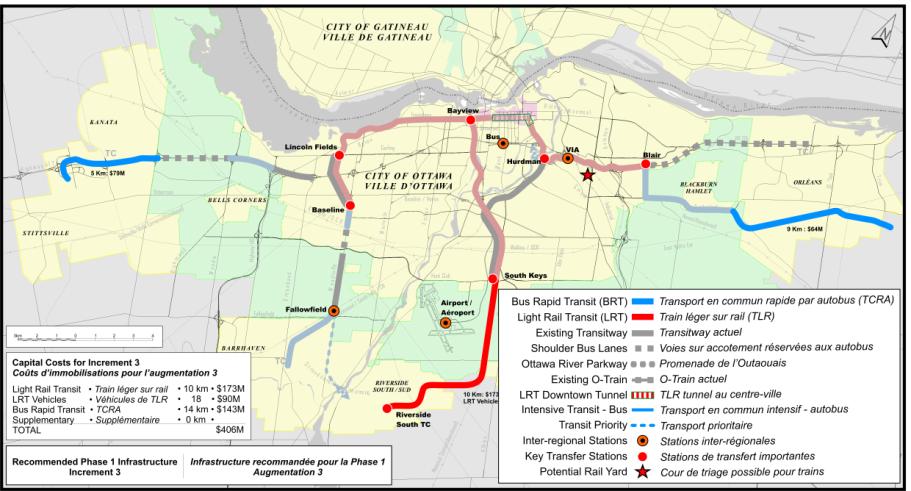
Figures 12:
Recommended Transit Infrastructure - Phase 2

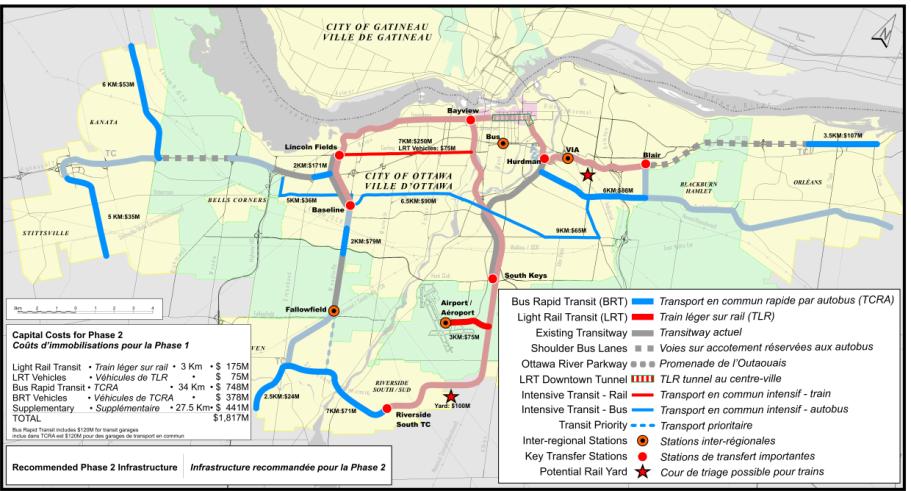
Risk Assessment
On 28 May 2008
Council passed a motion to commission a qualified professional to prepare a
financial risk assessment of approved network plan. Specifically, Council requested that the study assess the risks
related to the construction of an underground tunnel, and the risks associated
with not obtaining permission to use the Ottawa River Parkway.
The
purpose of a risk assessment is to identify and quantify the major risks
related to a program or project. It is
made up of two key aspects; risk likelihood and impact of occurrence. A risk assessment can be carried out at the
planning stage (as for the TMP), during preliminary engineering, as part of
final design, and prior to construction.
Objectives and outcomes of a plan-level risk assessment are summarized
in Table 13.
Table
13: Planning Stage Risk Assessment (US Department of Transportation, 2006)
|
Status
|
Typical Risk Issue
|
Objectives For Risk Assessment
|
Expected Outcomes
|
|
·
Focus is on
general alignment and mode
·
Project
details not defined; environmental reviews incomplete
·
Funding
possibly not committed
·
Public
support uncertain
|
·
Fatal or
significant environmental economic impacts
·
Funding
uncertainty
·
Uncertain
political and public support
·
Competing
interests and competing projects
|
·
Identify
implementation challenges - political, public acceptance, approvals
·
Establish
order of magnitude costs by option
·
Identify
major design and construction risks
|
·
Better
understanding of environmental, engineering, and construction issues facing
each project alternative
·
Order of
magnitude risk costs and possible total cost range for each option
|
Methodology and Scope
The assessment
evaluated the entire Rapid Transit Network and Supplementary Transit Corridors,
as presented for public review on 11 September 2008. It began with a team of engineers and City staff who developed a
risk register to categorize, describe and score potential risks. Next, an analysis of the $4.7 billion cost
estimate was undertaken. To conclude,
the assessment outlines a series of key mitigation strategies aimed at managing
cost and scheduling risks. A full copy
of the risk assessment has been attached to this report as Document 8.
Risk Assessment Summary
The consultant
assessed the top risks associated with the proposed Rapid Transit Network,
including the downtown tunnel and Ottawa River Parkway corridor. Below is a summary of risks that if left
unmitigated could potentially increase the cost of the program.
·
Difficulty securing bids because the cancellation of
the former light rail transit project.
Or fewer bids as a result of the large number of transit projects
occurring worldwide.
·
Scope change and the tendency to expand the project
scope, for example, more elaborate station design, environmental remediation,
and requirements for additional cut and cover sections.
·
Financial circumstances, such as construction inflation
and currency exchange rate.
·
Ability to obtain approval from the National Capital
Commission to use the Ottawa River Parkway and the cost of alternatives.
·
Station excavation and tunnelling may result in
increased costs to address geotechnical challenges. This may require a more expensive Earth Pressure Balanced Tunnel
Boring Machine and mining techniques for stations.
·
A number of technical issues, such as poor soils,
avoidance of utilities and hydro lines impacted by proposed routes could result
in additional costs.
·
More restrictive controls, for example, regulatory
issues regarding carbon reductions will likely emerge over the life of the
program.
·
Cost of suitable staging options to maintain bus rapid
transit service during conversion of transitway to light rail transit, and cost
of a suitable maintenance facility site.
Tunnel and Ottawa River Parkway
In response to the
Council Motion, a summary of the key findings associated with tunnel
construction and the Ottawa River Parkway has been provided.
Downtown Tunnel
·
Risk 1: A complex, high-cost feature of the plan
that requires specialized technology and expertise not often applied in Ottawa.
·
Risk 2: Location of station entrances has not
been defined. Also connecting passages
may be longer and more complex to build than anticipated.
·
Risk 3: The alignment of the tunnel has not been
determined.
·
Risk 4: Tunnel corridor crosses three fault
lines, potentially requiring significant ground improvement measures to stop
ground water inflows.
·
Risk Prevention: Depth of tunnel and selection
of boring equipment may add initial costs but reduce certain risks.
·
Risk Prevention: Improved ability to minimize
downtown disruptions during construction when compared to surface operation,
since disruption at surface level will mainly be to build access stations.
·
Risk Prevention: A Planning Environmental
Assessment study already underway.
Ottawa River Parkway Corridor
·
Risk 1: Requires National Capital Commission
approval for use of the Parkway as a light rail transit corridor.
·
Risk 2: Public opposition surrounding Parkway
proposal, augmented by the absence of a detailed design scheme showing project
integration.
·
Risk 3: Risk: The alternative use of Byron
Avenue is more expensive, requires some land acquisition, and will also face
substantial opposition from the local community.
·
Risk 4: The other possible alternative, a
grade-separated light rail transit system along Carling Avenue with continued
bus service along the Parkway to serve Tunney’s Pasture is the most expensive
alternative. Carling Avenue also serves
local transit needs, therefore the wide station spacing required to supply fast
through service on a grade-separated system makes this a less suitable
alternative.
·
Risk Prevention: Light rail transit to the west
will not proceed until alignment is established, Environmental Assessment
completed, and land rights obtained.
Conducting the environmental assessment as soon as possible will allow
informed discussion of alternatives.
The process should include full involvement of the NCC and a community
engagement strategy to obtain ensure participation of stakeholders.
Risk Adjusted Cost Analysis
The basic cost estimating approach used to
develop the $4.7 billion estimate was found to be sound and appropriate,
although it was not designed to include contingencies for all of the risks
identified in the assessment. For
example, the original cost estimates apply to the project as described, while
the risk analysis considers the potential that the project may change. The original estimates assume the cost of
construction and vehicles will be the same as it was in the past, while the
risk analysis considers the potential impact of market conditions, fluctuating
exchange rates and potential changes in economic circumstances, as well as the
need to maintain service during light rail conversion. Taking into account all of these additional
factors, and the uncertainty of the risks occurring, total project costs have a
50 per cent chance of being 10 per cent higher than the estimate, and could
vary above or below this figure depending upon which risks occur and which are
well controlled.
It is early in the planning process so the risk
adjusted cost range is relatively wide. As the mitigation measures are applied,
and as the design of the network proceeds, the range between the low and high-risk
adjusted prices will narrow. Mitigation
measures can have two effects, they can eliminate a risk (for example,
achieving delegation of Transport Canada’s regulatory authority), or they can
insure against or transfer risks (for example, using the more expensive
tunnel-boring machine to reduce the risk of problems during tunnel
construction). It has been determined
that many of the risks identified through the analysis (in particular risks
related to project scope creep, program phasing, and certain technical risks)
are largely within the control of the City.
Recommended Actions
Some of the
recommended actions that should be undertaken by the City in the short-term to
help mitigate potential risk include:
1. Establish project
phasing. The first light rail transit project has to be sustainable and therefore
must include the downtown transit tunnel, an east maintenance yard, and one
segment of the light rail transit (east, west, or south). The project must attract significant
ridership and be supported by the funding partners.
2. Initiate discussions with
the Minister of Transport, Infrastructure and Communities/Canadian
Transportation Agency to seek delegated authority for railway regulation
requirements, and identify the regulation approach that will be employed by the
City.
3. Seek Federal and Provincial
approval of the program as a whole, the phasing, and the financial plan. Seek agreement to either 1) fund a smaller
package of projects that can be completed by 2014 in the context that the City
will be looking for a larger share from next funding envelope to support the
first phase of light rail transit, or 2) extend the completion deadline for
funding and combine existing the $400M commitment with additional funds to get
enough funding for the first light rail transit project.
4. Conduct the Environmental
Assessment for the western corridor light rail transit line at an early date,
with a mandate to fully consider the Ottawa Parkway and Byron Avenue
alignments. Process should include a
community engagement strategy to obtain buy-in from stakeholders, and identify
ways to integrate the facility into the surrounding area and reduce the
perceived negative impacts. Carling
Avenue option will be raised and should be discussed, including rationale for
excluding this route, to help participants understand the options and rationale
for the approach.
5. Examine a range of light
rail transit procurement and contracting options and approaches and determine
the go-forward strategy early. The
strategy should respond to market concerns about cancellation, should consider
provincial requirements related to Infrastructure Ontario, and outline the best
approach to mitigate technical risks.
Conclusion
The assessment
suggests that most of the risks highlighted in relation to the plan are capable
of being mitigated; in fact the City is already undertaking a number of the
consultant's key recommendations. In
these early planning stages the City must prepare to undertake a series of
mitigation strategies identified through the assessment to help reduce the
potential for risk, for instance scope creep and the desire to elevate station
design beyond what’s practical and affordable.
The City should also develop an implementation strategy, which includes
project phasing and a procurement plan.
Alternative financing and procurement (AFP) will provide the City with
an opportunity to transfer risk to those who are most capable of handling them.
Roads
Road Infrastructure Requirements
Over the lifetime
of the TMP, the road network is expected to function in accordance with
Council’s operational policies and standards to provide transportation services
to existing and future population in an efficient and effective manner. Despite the substantial projected increase
in transit usage, there will also be an increase in demand for automobile
trips. Therefore, following the
identification of the transit system requirements to 2031 necessary to achieve
a 30 per cent City-wide peak hour transit modal split, a complementary
road network to accommodate the residual demand was identified.
Projected travel
demand indicated that while population and employment are projected to increase
by 30 per cent and 35 per cent respectively, overall person trips by automobile
are projected to increase by only 19 per cent and 25 per cent in the afternoon
and morning peak hours respectively.
These percentages reflect the greater share of travel by transit and
represent the return on the investment in the City’s rapid transit strategy.
The overall projected
automobile-based person trips were assigned to road network to estimate the
resultant road capacity deficiencies.
The analysis was conducted at a strategic screenline level to determine
future base road network requirements.
Table 14 summarizes the projected travel demand at major screenlines
during morning peak hour in the peak direction. Despite the substantial increases in the role of transit, there
will be higher traffic volumes in almost every major travel corridor during the
morning peak hour.
General assumption:
·
Achieving 26 per cent transit modal share (30 per cent
modal split target)
·
Achieving 12 per cent walking and cycling target
·
Vehicle occupancy rate of 1.2 (despite decreasing
trend)
·
Acceptable volume to capacity ratio of 0.9 (1.00 inside
the core)
The base
requirements were augmented to considering additional needs such as addressing
localized development needs and existing traffic operational issues as well as
providing network continuity.
Table 14: Projected Travel Demand – Screenlines
(Morning peak hour,
peak direction, person-trips by motorized modes)
|
Screenline
|
Total Demand
|
% Growth
|
Transit
Modal Split
|
|
|
Base year
|
2031
|
Total
|
Auto
|
Transit
|
Base year
|
2031
|
|
|
|
Rideau
River
|
32,250
|
41,150
|
28%
|
4%
|
62%
|
41%
|
52%
|
|
|
CPR
|
25,200
|
34,200
|
44%
|
4%
|
90%
|
37%
|
51%
|
|
|
Total: Inner Area Cordon
|
57,450
|
75,350
|
31%
|
4%
|
74%
|
39%
|
51%
|
|
|
Green’s
Creek
|
17,300
|
19,500
|
13%
|
-2%
|
40%
|
35%
|
43%
|
|
|
417
East
|
3,600
|
4,900
|
36%
|
36%
|
0%
|
0%
|
0%
|
|
|
Leitrim
|
4,400
|
9,100
|
107%
|
62%
|
1050%
|
5%
|
25%
|
|
|
Fallowfield
|
11,300
|
16,400
|
45%
|
23%
|
153%
|
17%
|
29%
|
|
|
Eagleson
|
13,000
|
19,700
|
52%
|
32%
|
113%
|
24%
|
34%
|
|
|
Total: Greenbelt Cordon
|
49,600
|
69,600
|
40%
|
24%
|
97%
|
23%
|
32%
|
|
|
Interprovincial
|
19,300
|
27,600
|
43%
|
11%
|
132%
|
26%
|
43%
|
|
|
CNR
West
|
13,800
|
18,000
|
30%
|
11%
|
104%
|
21%
|
33%
|
|
|
CNR
East
|
12,300
|
16,100
|
31%
|
12%
|
82%
|
27%
|
37%
|
|
|
Western
Parkway
|
23,400
|
28,800
|
23%
|
4%
|
88%
|
22%
|
34%
|
|
|
Terry
Fox
|
6,000
|
11,700
|
95%
|
66%
|
500%
|
7%
|
21%
|
|
|
Rideau
South
|
8,000
|
11,900
|
49%
|
30%
|
200%
|
11
|
23%
|
|
|
Bilberry
Creek
|
10,700
|
12,900
|
21%
|
15%
|
31%
|
35%
|
40%
|
|
|
Smyth
/ Hydro
|
7,900
|
10,300
|
30%
|
28%
|
33%
|
54%
|
55%
|
|
Road Infrastructure Phasing
The fundamental
objective that governed the identification of road implementation priorities is
to minimize road expenditure in the early years while investment in transit is
given a high priority to accelerate the shift to transit. Therefore, road projects in the first phase
were limited to:
·
New road links without which imminent planned growth
can not occur, e.g., Blackburn Hamlet Bypass Extension;
·
Widening existing arterials which are required to
service known development proposals, e.g. Hazeldean Road widening from Terry
Fox to Iber;
·
Widening existing arterials, which have been at
capacity for sometime, e.g. Limebank Road widening from Riverside Drive to Earl
Armstrong Road; and
·
Approved Council priorities, i.e. Terry Fox extension
from Goulbourn Forced Road to South of Richardson Side Road, and
Strandherd/Armstrong Bridge.
Project priorities
in the second and third phases were identified based on projected future growth
rate.
Listing of all road
network requirements and phasing are included in Table 15 of this report and
also in Table 8.4, Annex B and Maps 10a, 10b, and 10c of the TMP document. The vast majority of future arterial needs
are located within the suburban growth centres and through the Greenbelt
leading to/from these centres, as opposed to inside the Greenbelt.
It is important to
note that the road network analysis assumes that all of the identified/required
transit infrastructure is in place, and that the 30 per cent City-wide peak
hour transit modal split is achieved. If
this does not occur, there will be a need for additional road widening or new
road links not identified/recommended in the TMP.
As a result of the
updated screenline analysis, several road projects previously identified in the
2003 TMP are no longer required and very few new projects have been added. Tables 7-3 and 7‑4 of Document 9, list
road projects recommended for deletion or addition from/to the 2003 TMP.
Table 15: Recommended Implementation Phasing of the
Road Projects
|
PHASE #
|
SECTOR
|
PROJECT
|
DESCRIPTION
|
COST
($M)
|
|
Phase1
|
East
|
Belcourt
Boulevard and
Mer Bleue Road Connection
|
-
Widen to four lanes (Innes to
Renaud)
- New four-lane collector (Belcourt to Mer Bleue)
|
23.7
|
|
Blackburn
Hamlet Bypass
Extension
|
New
two-lane road (Navan to Tenth Line and Portobello to Trim)
|
36.3
|
|
Mer
Bleue Road
|
Widen
to four lanes (Innes to South of Renaud)
|
24.1
|
|
Ottawa
Road 174
|
Widen
from five to six lanes (Blair to split )
|
7.0
|
|
|
Widen
to four-lane (Charest Way to BBHBP Ext.)
|
14.5
|
|
Trim
Road
|
Widen
to four lanes (174 to BBHBP Ext)
|
47.5
|
|
South-East
|
Alta
Vista Transportation Corridor
|
New
two-lane road (Riverside to Hospital Ring Rd.)
|
65.0
|
|
Earl
Armstrong Road
|
Widen
to four lanes (River Rd. to Limebank)
|
33.0
|
|
Hunt
Club Road Extension
|
New
two-lane road with interchange (Hawthorne to 417E)
|
58.4
|
|
Limebank
Road
|
Widen
to four lanes (River Rd to Earl Armstrong)
|
53.0
|
|
Riverside
Drive
|
Widen
to four lanes (Hunt Club to Limebank)
|
13.0
|
|
Spratt
Road Extension
|
New
two-lane collector road (Limebank to Bowesville)
|
11.9
|
|
Strandherd
– Earl Armstrong Bridge
|
New
six lane bridge (four general purpose
plus two transit lanes)
|
48.0
|
|
South-West
|
Chapman
Mills Drive
|
New
four-lane collector road
(Strandherd to Woodroffe)
|
30.5
|
|
Greenbank
Road
|
Widen
to four lanes (Malvern to Strandherd)
|
14.0
|
|
Jockvale
/ Longfields / River
|
New
four-lane road and Jock River Bridge Twinning
(Strandherd to south of Jock River)
|
19.7
|
|
Longfields
Drive Extension
|
New
two-lane collector road (Woodroffe to South Pointe Business Park)
|
14.0
|
|
Strandherd
Drive
|
New
six-lane road (Woodroffe to Prince of Wales)
|
23.5
|
|
West
|
Campeau
Drive
|
- Widen to four lanes ((Kanata Avenue to Didsbury)
- New four-lane road (Didsbury to
Huntmar Drive)
|
34.0
|
|
Country
Club / Jinkinson Road
|
New
two-lane collector road (Jinkinson to Country Club Subdivision)
|
2.0
|
|
Goulbourn
Forced Road Realignment
|
New
two-lane collector road (Kanata to Terry Fox)
|
12.6
|
|
Hazeldean
Road
|
Widen
to four lanes (Terry Fox to Iber Road)
|
21.6
|
|
Hope
Side Road / Crown Ridge Road
|
New
two-lane road including Crown Ridge Road completion (Richmond to Moodie
location tbd)
|
8.9
|
|
Kanata
Avenue
|
Upgrade
existing two lanes (Goulbourn Forced to Old Richardson Side)
|
4.5
|
|
Terry
Fox Drive
|
New
two-lane road (Richardson Side to Goulbourn Forced)
|
45.0
|
|
TOTAL
PHASE 1 PROJECTS
|
665.7
|
Table 15: Recommended Implementation Phasing of the
Road Projects (continued)
|
PHASE #
|
SECTOR
|
PROJECT
|
DESCRIPTION
|
COST
($M)
|
|
Phase2
|
East
|
Belcourt
Boulevard
|
New
four-lane road (Renaud to Navan)
|
15.0
|
|
Blackburn
Hamlet Bypass Extension
|
New
four-lane road (BBHBP to Navan at Hydro Corridor)
|
17.5
|
|
Frank
Kenny Road Extension
|
New
four-lane road (Realigned Trim to Innes)
|
27.4
|
|
Mer
Bleue Road
|
New
four-lane road (South of Renaud to Navan)
|
16.9
|
|
Navan
Road
|
Widen
to four lanes (BBHBP Extension to Mer Bleue)
|
35.0
|
|
Ottawa
Road 174
|
Widen
to six lanes (Blair to Jeanne d’Arc)
|
28.9
|
|
St.
Joseph Boulevard
|
Widen
to four lanes (East of Tenth Line to Dairy)
|
12.5
|
|
Tenth
Line Road
|
Widen
to four lanes (Vanguard to Urban Boundary)
|
19.0
|
|
Innes
– Walkley – Hunt Club Link
|
New
two-lane road (Innes to Highway 417 East)
|
14.0
|
|
South-East
|
Airport
Parkway
|
Widen
to four lanes (Brookfield to Airport)
|
37.1
|
|
Alta
Vista Transportation Corridor
|
New
two/four lane road (Highway 417 to Riverside)
|
45.0
|
|
Bank
Street
|
Widen
to four lanes (South of Leitrim to Findlay Creek)
|
16.1
|
|
South-West
|
Cambrian
Road
|
Widen
to four lanes (New Greenbank to
Jockvale)
|
16.3
|
|
Greenbank
Road (new Jock River Bridge)
|
Relocated
four-lane road and new Jock River
Bridge
(Jockvale to Cambrian)
|
71.1
|
|
Jockvale
Road
|
Widen
to four lanes (Jock River south to Prince of Wales)
|
26.1
|
|
Prince
of Wales Drive
|
Widen
to four lanes (Fisher to Woodroffe)
|
90.3
|
|
Strandherd
Drive
|
Widen
to four lanes (Fallowfield to Jockvale)
|
60.3
|
|
West
|
Campeau
Drive
|
Widen
to four lanes (March to Kanata Avenue)
|
16.9
|
|
Carp
Road
|
Widen
to four lanes (Hazeldean to Highway 417)
|
17.2
|
|
Eagleson
Road
|
Widen
to four lanes (Cadence Gate to Hope Side)
|
14.1
|
|
Earl
Grey Underpass
|
Underpass
linking Goulbourn Forced Road and Earl Grey
|
3.5
|
|
Hazeldean
Road
|
Widen
to four lanes (Iber to Stittsville Main)
|
19.6
|
|
Hope
Side Road
|
- Widen to four lanes
(Eagleson to Richmond)
- New two-lane road (Moodie to HWY
416
|
38.7
|
|
Huntmar
Drive
|
Widen
to four lanes (Campeau Extension to Cyclone Taylor and Palladium to Maple Grove )
|
21.9
|
|
Kanata
West Main Street
|
New
two-lane road (Maple Grove to Palladium )
|
15.2
|
|
Kanata
West North-South Arterial
|
New
two-lane road (Hazeldean to Fernbank)
|
18.0
|
|
Palladium
Drive Realignment
|
Realign
existing four-lane road (Huntmar to North-South Arterial)
|
6.3
|
|
Terry
Fox Drive
|
Widen
to four lanes (South of Winchester to Eagleson)
|
30.9
|
|
Central
|
Albert
Street
|
Widen
from four to six lanes (Booth to Empress)
|
2.5
|
|
TOTAL
PHASE 2 PROJECTS
|
753.3
|
Table 15: Recommended Implementation Phasing of the
Road Projects (continued)
|
PHASE #
|
SECTOR
|
PROJECT
|
DESCRIPTION
|
COST
($M)
|
|
Phase3
|
East
|
Blackburn
Hamlet Bypass
|
Widen
to six lanes (Innes west of Blackburn Hamlet to Navan)
|
20.1
|
|
Blackburn
Hamlet Bypass Extension
|
New
two-lane road (Trim to Frank Kenny)
|
8.1
|
|
Coventry
Road
|
Widen
to four lanes (Belfast to St. Laurent Shopping Centre)
|
4.1
|
|
South-East
|
Alta
Vista Transportation Corridor
|
New
two/four lane road (Hospital Ring Rd. to Walkley)
|
17.0
|
|
Bank
Street
|
Widen
to four lanes (Findlay Creek to Greely)
|
35.2
|
|
Earl
Armstrong Road
|
- Widen to four lanes
(Limebank to High Road)
- New two-lane road (High Road to
Bank)
|
58.8
|
|
Hunt
Club Road
|
Widen
to six lanes (Riverside to Bank)
|
23.2
|
|
Leitrim
Road
|
Widen
to four lanes (River Road to east of Limebank)
|
11.7
|
|
Leitrim
Road Realignment
|
New
four-lane road (East of Limebank to Bowesville)
|
18.4
|
|
Limebank
Road
|
Widen
to four lanes (Earl Armstrong to Mitch Owens)
|
39.1
|
|
Riverside
Drive
|
Widen
to six lanes (Hunt Club to Limebank)
|
10.0
|
|
South-West
|
Barnsdale
Road
|
Widen
to four lanes (Highway 416 to Prince of Wales)
|
21.1
|
|
Fallowfield
Road
|
Widen
to four lanes (Cedarview to Strandherd and Woodroffe to Prince of Wales)
|
37.9
|
|
New
Fallowfield Extension
|
New
four-lane collector (Strandherd to McKenna Casey)
|
15.1
|
|
New
Interchange on Highway 416
|
2nd
Interchange at Barnsdale Road (Highway 416 at Barnsdale)
|
25.5
|
|
Second
New Rideau River Bridge
|
Four-lane
crossing of Rideau River (Fallowfield/Prince of Wales to Leitrim/Limebank)
|
50.8
|
|
Strandherd
Drive
|
Widen
to six lanes (Greenbank to Woodroffe)
|
14.2
|
|
West
Hunt Club Road
|
Widen
to six lanes (Highway 416 to Prince of Wales)
|
54.6
|
|
West
|
Kanata
West North-South Arterial
|
New
four-lane road (Hazeldean to Palladium)
|
22.0
|
|
Katimavik
Road
|
Widen
to four lanes (Terry Fox to Eagleson)
|
33.3
|
|
Hazeldean
Road
|
Widen
to four lanes (Carp to Stittsville Main)
|
12.2
|
|
Maple
Grove Road
|
Widen
to four lanes (Huntmar to Terry Fox)
|
18.5
|
|
March
Road
|
Widen
to four lanes (North of Morgan’s Grant to Dunrobin)
|
38.2
|
|
Richmond
Road
|
Widen
to four lanes (Carling to Golden)
|
51.8
|
|
Terry
Fox Drive
|
- Widen to four lanes (March to south of
Richardson Side)
- Widen to six lanes (Campeau to Palladium)
|
51.8
|
|
TOTAL
PHASE 3 PROJECTS
|
692.7
|
What we have heard on proposed road projects:
The most commonly
articulated comment with respect to the road infrastructure projects was that
the city should spend less on road infrastructure and instead redirect money
towards mass transit. Several people
noted the need to complete the Strandherd-Armstrong Bridge while several other
roads projects generated mixed comments and discussions, including the Airport
Parkway, the Alta Vista Transportation Corridor and Ottawa Road 174. Several emails were received near the end of
the consultation period regarding the need for an outer Ring Road. Most of the support for a Ring Road was
related to the Interprovincial Crossing Study as means to support an
alternative location other than Kettle Island.
Recommendations on Key Road Projects:
Interprovincial Crossings and King Edward Avenue
The demand analysis
projected a substantial increase in travel demand across the Ottawa River (43%
and 39% in the morning and afternoon peak hours). This substantial increase
warrants two additional river crossings.
The location(s) of future crossing(s) of the Ottawa River is (are) the
subject of an ongoing Environmental Assessment Study lead by the National
Capital Commission. Results of the Phase 1 of the Environmental Assessment will
be presented to Transportation Committee in early 2009.
Even with the
construction of a new east-end crossing, a six-lane King Edward Avenue is
identified as required from a road network capacity and goods movement mobility
perspective. However, taking into consideration the negative impact of traffic
on King Edward on the surrounding communities, reducing King Edward to four
lanes is feasible under the following conditions:
·
Construction of a new interprovincial crossing in the
east end that is adequately linked to the existing freeway network on either
side of the Ottawa River;
·
Achieving the 43 per cent transit modal split target
across the Ottawa River Screenline (compared to the current 25 per cent); and
·
Removal of King Edward Avenue from the City's Truck
Route Network.
Alta Vista Transportation Corridor (AVTC)
At the Rideau River
Central/Queensway Screenline, even with the achievement of 51 per cent transit
modal split in the afternoon peak hour (from current 37%), substantial
deficiency in roadway capacity is projected (between 2,700 to 3,000 passenger
car unit per hour (pcu)). The proposed
widening of the Queensway at the Hurdman Bridge by Ministry of Transportation
of Ontario (MTO) will address approximately half of the projected deficiency. Further south, at the Smyth/Hydro corridor,
even with the achievement of the 52 per cent transit modal split target in the
afternoon peak hour (from current 47%), a deficiency of approximately 500 pcus
is projected.
To address the
remaining deficiency at Rideau River Central/Queensway and Smyth/Hydro
Screenlines, AVTC is required.
Furthermore, intensification and redevelopment in the Alta Vista area,
primarily at the Hospital Lands and the identification of the AVTC as a transit
priority link, AVTC is recommended to be a four-lane roadway, including two
high occupancy vehicle/transit lanes from Nicholas Street to Walkley Road to
serve both general traffic needs and for enhanced transit service to the
Hospital Campus.
Airport Parkway
At the CNR East
Screenline, subject to the achievement of the projected 37 per cent transit
modal split target (compared to the current 27 per cent) during the morning
peak hour, a maximum deficiency of approximately 400 pcus is projected. This
projected deficiency would require the addition of one lane per direction to
the current capacity of the screenline, which could be achieved by either
twinning of the Airport Parkway or six-laning Conroy Road for general traffic.
As the six-laning of Conroy Road from Hunt Club Road to Walkley Road may be
required for transit priority purpose, the twinning of the Airport Parkway is
recommended since it will also serve the anticipated growth of air travel and
employment at the Ottawa MacDonald-Cartier International Airport and growth in
the suburban communities of Riverside South and Leitrim. The twining would also relieve delays and
safety issues due to current Parkway congestion between Brookfield
Road and Hunt Club Road. The
section between Brookfield Road and Hunt Club Road was initially identified as
a Phase 1 project, with the twinning to the airport as a Phase 2. However,
since the implementation of the North-South LRT is recommended for
implementation as part of Phase 1 of the transit program, the twinning of the
Parkway was deferred to Phase 2 (20016-2022).
Ottawa Road 174
The following are staff
recommendations regarding Ottawa Road (OR)174 based on the analysis of
projected demand in the East end:
·
At the Green’s Creek Screenline, subject to the
achievement of a 43 per cent transit modal split, widening
of OR174 between the Jeanne d’Arc and Highway 417/OR174 split is still been
recommended to resolve capacity deficiency as well as operating and safety
issues. The section between Blair and
the split is recommended to be implemented in Phase 1 (by 2015) so it can be
used by transit vehicles during the conversion of the East Transitway to
rail. The rest of the project is
recommended to be deferred to Phase 2 (2016-2022) to minimize road investment
in early years of the Plan.
·
At the periphery of the East Urban Community, projected
demand could be handled by the OR174, St. Joseph Boulevard, Innes, and Navan
Roads. Therefore, by year 2031, the
widening of OR174 east of Trim Road to four lanes is not recommended.
Draft 2008 TMP Document
The draft TMP document (Document 10) differs from the 2003
TMP in that it:
·
Consolidates and reduces the number of chapters from 14
to 8 to remove duplications and for easy reference
·
Includes numerous references to new/revised guidelines
or studies completed in the last five years,
·
Introduces new policies, with minimal changes to
existing policies
·
Revamps the required infrastructure project lists and
their proposed phasing.
A complete copy of
the TMP is found on the web site www.ottawa.ca/tmp
and in the separately distributed as Document 10: 2008 Draft Transportation
Master Plan Document (TMP). A summary
of changes includes:
·
Incorporates 2005 Origin-Destination survey data and
2031 population/employment growth and projected travel demands; reconfirms
modal share targets for 2031
Chapter 3: Strategic Directions
·
Includes revised Transportation Vision and the
accompanying elements and principles
·
Adds under Supportive Land Use, reference to the new
Zoning By-law regulating minimum and maximum parking rates near rapid transit
stations and how the new Transportation Impact Assessment Guidelines require
addressing all transportation modes and not just automobile/parking issues
·
Includes in the Transportation Demand Management (TDM)
section how the City and its employees should become more active in TDM
implementation and support for private-sector carsharing services
·
Places in this chapter a number of sections previously
found elsewhere in the Plan, including: safety and security, the environment,
managing and maintaining assets, funding and measuring performance. On the last
item there is the addition of a policy on the City participating in the Ontario
Municipal Benchmarking Initiative. In
the environment section, reference is made to the now approved Air Quality and
Climate Change Management Plan and to the Environmental Noise Control
Guidelines.
Chapter 4: Active Transportation (Walking and Cycling)
·
Bring together in this chapter many overlapping
policies from the previously separate chapters on walking and cycling. The
Ottawa Cycling Plan was approved by Council this summer and polices have been
revised to reflect this. A policy is
added to indicate that the City will work with key partners (including National
Capital Commission and Gatineau) to investigate the feasibility of a smart bike
program such as those in Montréal and Paris. The Ottawa Pedestrian Plan is
underway and a number of draft policies from that Plan are noted for inclusion
if they become part of the approved Pedestrian Plan. Polices are added on the Snow-Go and Yellow Grit Programs and the
newly approved direction to install pedestrian countdown signals at traffic
lights.
Chapter 5: Public Transit
·
Adds a new policy to investigate alternative service
delivery methods and complementary modes in areas where minimum ridership
levels cannot be maintained through conventional services. Direction is given to investigate creating
a policy on air right use over rapid transit facilities and to acquiring unused
rail and hydro corridors for possible future transit corridors, including
stations, that may be needed now or at a timeframe beyond this TMP’s planning
horizon. The spare bus ratio is to be
improved by reducing it from 17 per cent to 10 per cent and the City will examine
the use of fuel cell technology in accordance with its 2004 Fleet Emission
Reduction Strategy.
Chapter 6: Roads and Motor Vehicles
·
Brings in former short chapters on parking and
ridesharing. The former presents
policies under consideration as part of the draft Municipal Parking Management
Strategy, including: a pilot project to
showcase proactive parking management strategies in the Centrepointe mixed-use
centre, and the linking of parking and TDM initiatives. The section on ridesharing references the
promotion of OttawaRideMatch.com and it
adds Ottawa Road 174 (split to Jeanne d’Arc) to the list of roadways for study
of possible carpool lanes
·
Adds in the road design section references to: roundabouts, road diets, Right-of-Way
Lighting policy and echoing how the Official Plan will limit new driveway/road
access along the rural portion of Ottawa Road 174
·
Introduces the new term Road Corridor Optimization for
comprehensive studies of a corridor.
The approved Area Traffic Management Guidelines are now referenced. The
road safety section introduces a policy to establish a GIS-based collision and
traffic volume database that would enable advanced road safety monitoring and
management initiatives.
Chapter 7: Intercity Travel
·
Revised introduction to reflect changed status of
planning for the Carp Airport.
Chapter 8: Implementation
·
Updates the listing of infrastructure projects and
costing
·
Proposes a new document sitting outside of the TMP
called the “Transportation Outlook”.
While the TMP is updated every five years and the Long Term Financial
Plan has a 10-year horizon, the new Transportation Outlook would look at a
shorter term closer to the three-year budget.
It would provide Council with more focused and strategic advice
regarding implementation priorities, particularly in the face of fiscal
expectations.
Annex A - Required
Infrastructure Projects – updates transit and road infrastructure projects
lists, and the cycling infrastructure project list reflects the Ottawa Cycling
Plan’s first phase priorities
Annex B -
Transportation Performance Objectives and Indicators – is updated to reflect
two studies done since 2003 on performance objectives and indicators
Map 1: Multi-use
Pathways and Scenic-Entry Routes (Urban); Map 2: Cycling Network, Multi-use
Pathways and Scenic-Entry Routes (Rural) and Map 3: Cycling Transportation
Network (Urban) – reflect the Greenspace Master Plan, the Ottawa Cycling Plan,
the Rural Pathways Plan and the NCC’s Pathway Network for Canada’s Capital
Region
Map 4: Rapid
Transit Network – shows the new rapid transit and supplementary transit
network. Map 5a: Transit Network – Phase 1, Map 5b: Transit Network – Phase 2
and Map 5c: Transit Network – Phase 3 are new maps introduced, information for
which was previously only presented in text format
Map 6: Urban Road
Network and Map 7: Central Area/Inner City Road Network – changes primarily due
to new road construction or EA approvals in urban areas outside of the
Greenbelt. Map 8: Rural Road Network
and Map 9: Road Network - Select Villages – has very minor changes such as
those stemming from the Constance Bay CDP
Map 10a: Road
Network – Phase 1, Map 10b: Road Network – Phase 2, Map 10c: Road Network –
Phase 3 – are new maps introduced, information for which was previously only
presented in text format
Implementing the TMP and
Next Steps
The successful
implementation of the Transportation Master Plan requires that concurrent
efforts be undertaken to achieve the key strategies such as creating supportive
land uses, managing transportation demand, and to construct the identified
transportation infrastructure. Since
the TMP is a long-range planning document, and to aid in the implementation
process, staff intends to produce a Transportation Outlook to help guide
short-term decision-making on infrastructure priorities.
The following
section summarizes the investment strategy that will be developed to aid in
securing required funds to build, maintain and operate the rapid transit plan.
Investment Strategy for the Rapid Transit Network
To ensure the Rapid
Transit Network (RTN) is affordable, a full investment strategy outlining how
the City can secure the funds required to build, maintain and operate it is to
be developed. The strategy will allow Council to fully understand the short and
long-term financial implications of the RTN on the capital and operating
budgets for this public transit investment.
The Investment
Strategy will anchor the importance of risk management to ensure that the RTN
projects stay on schedule and do not cost more than anticipated. Best practices
and experts in project delivery will be harnessed to ensure that at the project
stage, risks will be managed and projects will be delivered on time and on
budget. At the RTN plan level some work has already been completed to assess
risks. The financial risk assessment
appended to this report provides mitigation strategies for a number of
potential risks including those that may occur with the downtown tunnel and western
parkway. Moving forward, all risks will be assessed and managed carefully.
To gain a head
start on the affordability of the RTN, the City Treasurer has prepared a high
level analysis for the first 10 years to assess the level of City funding
which could be made available through reserves, development charges, gas tax
and debt, to fund the first set of RTN projects. It demonstrates that subject to some reasonable assumptions, the
City will be able to finance its share of the construction of the first phase
of RTN projects, provided the federal and provincial governments contribute
two-thirds of the capital costs of the system.
Transit Services
has also been examining the operating cost implications of the implementation
of the RTN relative to other alternatives. The preliminary results confirm the
expectation of operating savings from the implementation of LRT; more detailed
analysis is forth coming. A 10-year rolling operational plan is being prepared
that will be updated annually to take into consideration changes in revenues
and expenses once the system is in operation. To provide an extended view of
the operational requirements of the RTN, this plan will be extrapolated over
the 25 year Investment Strategy time horizon.
To ensure the RTN
will be affordable and acceptable for government funding, staff are
recommending a comprehensive investment strategy with a number of components,
to be prepared over the next several months. As well, staff will be undertaking
and submitting to senior governments a benefit/cost analysis of each RTN project
to ensure economic, environmental and social needs and impacts are taken into
direct account. This submission requirement was in place with the North South
LRT project whose business case concluded that there would be a return on
investment for society in terms of travel time savings, vehicle operating
costs, accident cost savings and other benefits.
Component No. 1 – Financial Tools and Incentives for Transit oriented
development
Component No. 1 of
the investment strategy will identify and assess the incremental revenue
requirements beyond available government funding for the RTN. As well, this
effort will examine the tools that can be used to encourage transit friendly
development next to RTN stations. While property tax and fare increases are
among the current available alternatives, there are other options that will be
needed to be reviewed and assessed for their incremental revenues. Most of this
work was completed as part of the north south LRT project. However, an updating
exercise is warranted that will include a new assessment of the incremental
revenue that may be captured as part of this new RTN.
Existing Financial Tools
This review will
include tools the City of Ottawa already has legislative authority to enact
such as:
a. Section
37 agreements allowing density incentives for transit oriented development at
station locations in exchange for revenue and other contributions to the RTN
stations;
b. Station
connection fees similar to what Toronto has in place next to their RTN. These
fees must be paid before a physical connection from a private or public sector
building is made to a City RTN station;
c. Area
Specific Fees as part of the City’s new Development Charges (DC) Bylaw which
must be enacted by July 2009. While the City currently has area wide transit
DC, specific charges based on a prescribed benefiting area may also be
collected to offset the RTN capital costs;
d. Community
Design Plans that will include the City’s Brownfield program that may encourage
development of contaminated sites such as the Bayview yard land;
e. Land
value uplift agreements including City owned property next the RTN, etc. In
2006 the NS LRT Value Uplift report estimated that across the six City-owned
properties next to NS line, the value uplift capture could be as high as $200M.
This was a gross estimate and did not net out land development costs and profit
sharing through joint venture arrangements.
f.
An assessment of sponsorship and advertising revenues along
the entire RTN.
New Financial Tools
Identification of
new financial tool that may be secured through legislative amendments will need
to be reviewed and assessed. Such tools could include Tax Incremental
Financing, land transfer tax, road tolls, parking fees, etc that exist in other
Ontario jurisdictions (most notably
Toronto under the City of Toronto Act), as well as other approaches taken in
Vancouver, Calgary and Montréal to support their RTN operations.
Staff anticipate
that the federal and provincial governments will require that all available
financial tools be assessed for potential sources of revenue for the RTN.
Component No. 2 – Develop a Financial Model
Component No. 2
will involve the development of a comprehensive Financial Model that covers the
first 25 years from construction to the completion of the Rapid Transit
Network. The model will consider the capital costs of developing the network,
cash flow requirements during construction periods, debt service requirements,
major rehabilitation requirements, the impact of life cycle costs to maintain
the transit system and the operating costs of transit services and LRT, taking
into account the forecast ridership increases as well as identifying any
assumptions. The model will identify the timing and magnitude of funding gaps
that might arise over the full life cycle of the RTN.
This work will be
undertaken when the necessary inputs such as the Transit Services Rolling
Operational Plan mentioned above and financial Tools referenced in Component
No. 1 are completed.
Component No. 3 – Implementation Plan
The third part of
the strategy would be to complete an investment strategy that clearly
identifies how the City will fund the RTN and Supplementary Corridors in the
short, medium and long term, and identify the financial instruments which may
need to be employed over the 25-year period to ensure the continued viability
of the transit system. It will provide
a basis for Council to examine and debate various alternative approaches to the
long-term funding of the RTN, and initiate the steps necessary to acquire new
funding powers.
To get started,
staff recommend Council support the Terms of Reference for the first component
of the Investment Strategy (Document 11). This stand-alone work on the
Financial Tools can proceed immediately and will require a number of stakeholders
including the Downtown Business Coalition to be engaged as this analysis
unfolds. Staff will report back on the findings of this assessment in first
half of 2009, which will form an input into the financial model (Component No.
2) and ultimately the investment strategy.
CONSULTATION
The TMP consultation objectives have been to engage, in a meaningful
way, a broad range of citizens and stakeholders in a dialogue around Ottawa’s
long-term transportation planning.
Towards this effort, the consultation program has consisted of three
main phases, as summarized below.
Document 12 provides additional detail about the most recent round of
consultations (Phase III).
Phase 1(September to December 2007)
Phase 1 took place
throughout September to December 2007 and focused on informing citizens in new
and unique ways about various transportation related challenges and
opportunities facing Ottawa. Within
this context, the TMP Vision and Guiding Principles were reviewed and key
information was collected with respect to the development of a preferred rapid
transit network.
Phase II (March to April 16, 2008)
Phase II
consultations began March 3 and concluded April 16, 2008 as an exercise to
inform the public about the four Downtown Rapid Transit Network Options and their
implications on the overall transportation systems. A number of consultation
activities were undertaken during this time, as detailed in a staff report
presented to Committee and Council in May 2008.
Phase III (September 11 to September 30, 2008)
The third and final
phase of consultation began September 11 and concluded September 30, 2008. The
objective was to inform and gather feedback on four potential implementation
scenarios for the 2031 rapid transit network that Council approved on May 28,
2008. This also included soliciting
feedback on the evaluation criteria to assess the different implementation
scenarios and the proposed supplementary transit networks, as well as the
proposed road infrastructure projects and the overall policy direction of the
TMP.
A number of
activities were developed to provide flexible and convenient opportunities for
citizens to provide input to the City.
These included:
·
Open Houses held at five different locations throughout
the city;
·
Registered Discussion Groups as part of each Open
House;
·
Online materials and consultation forums;
·
Stakeholder Focus Group Sessions;
·
City Advisory Committee Discussion Groups;
·
Internal and External Agency Group Meetings;
·
Mail, fax and email correspondence.
Open
Houses
Five Public Open
Houses were held during the first three weeks of September in various locations
across the city. In total, 376
individuals attended the Open Houses and 75 comment sheets were completed and
submitted at the events.
Registered
Discussion Groups
Registered Discussion
Groups were conducted between 7:00 and 8:00 p.m. at each of the Public Open
Houses. In total, over 100 people
participated in the discussion groups.
The format involved up to eight participants seated at each table and
supplied with information and maps pertaining to the transit implementation
scenarios, evaluation criteria, supplementary transit networks, and road
infrastructure projects. Technical
facilitators led the discussions at each table and all comments and input was
collected on flips charts.
Stakeholder
Focus Group Sessions
Three Stakeholder
Focus Group Sessions were held at City Hall and Confederation High School,
between September 11, and September 17, 2008.
They were designed to allow key stakeholders to provide their input into
all elements of the transit implementation scenarios, evaluation criteria,
supplementary transit networks, and road infrastructure projects.
City Advisory Committee Discussion Groups
Members of each of
the City of Ottawa’s Advisory Committees were invited to participate in a group
meeting. The session was held at City
Hall on September 30, 2008, and consisted of a presentation on the TMP followed
by a question and answer period.
Additional meetings were held with Environmental Advisory Committee;
Roads and Cycling Advisory Committee; and the Pedestrian and Transit Advisory
Committee.
Online
Materials and Consultations
The Beyond Ottawa
20/20 website (www.ottawa.ca/beyondottawa2020) has been extensively used to
promote the TMP update process, including all Public Open House materials,
online feedback forms, OttawaTALKS and additional background information. All information has been provided in both
official languages. In total, 836
written submissions were received in the month of September via the online
comments, fax, mail and email.
Internal
and External Agency Group Meetings
Internal and
External Agency meetings were held at City Hall on September 12, and
September 15, 2008. Both meetings
consisted of a 45-minute presentation that updated participants on the TMP and
the four transit implementation scenarios, followed by an open discussion. Participants included Ontario Ministry of
Transportation; Public Works and Government Services Canada; Ministere des
Transports du Quebec; Transports Quebec; NCC; Ontario Ministry of Energy and
Infrastructure; and Ontario Ministry Of Public Infrastructure Renewal as well
as staff from various City of Ottawa departments. Representatives of First Nations of the Ottawa Valley also
participated in a one-on-one briefing session in this regard.
Approximately 900
written submissions were received during the month of September including
numerous discussions and meetings as a result of the above-mentioned
activities. A summary of the
consultation efforts and feedback is attached as Documents 12 and 13.
FINANCIAL IMPLICATIONS
The implementation
of this Transportation Master Plan will cost about $8.36 billion over 22
years in new infrastructure and services, including $7.24 billion for capital
costs, $1.12 billion for operations and maintenance as shown in Table 16.
Table 16 – Total Implementation Costs of New Infrastructure and
Services
|
Facility Type
|
Capital Cost
($ millions)
|
Operating and
Maintenance Cost
($ millions, net of
revenues)
|
Total Cost
($ millions)
|
|
Rapid Transit
|
4,727
|
900
|
5,627
|
|
Transit Priority
|
260
|
8
|
268
|
|
Bus garages
|
120
|
30
|
1520
|
|
Transportation Demand Management
|
25
|
--
|
25
|
|
Roads
Includes walking and cycling facilities
|
2,112
|
180
|
2,292
|
|
Total
|
7,244
|
1,118
|
8,362
|
Subject to Council
approval, the updated TMP will provide the basis for ongoing annual capital and
operating budget preparation, the Long Range Financial Plan and the Development
Charges By-laws. However, the City’s
ability to pay for projects will influence the identified priorities and the
rate of implementing them.
The rapid transit
implementation priorities identified in this report total $3.03 Billion in
spending for Phase 1 of which $1.68 Billion is required for the first
increment. These costs are in 2007
dollars and do not include the cost of incremental land purchases. In order to determine the ability of the
City to fund the priorities a high level model was built that forecasted the
sources of capital funding available for Transit for a 10- and 20-year
timeframe.
The funding sources available for Transit capital include:
·
Provincial gas tax (assumed not to increase over
current levels)
·
Federal gas tax (assumed not to increase over current
levels)
·
Development charges (assumed to increase by 50 per
cent)
·
Transit levy contributions to capital and debt
servicing (increased annually by the rate of inflation, as per policy)
·
Provincial bus replacement program revenues (assumed to
continue).
The model also
assumed that the Federal and Provincial governments would each contribute
one-third of the funds required for the Transit Plan, which in the first
increment would be valued at $560 million from each level. The Federal government’s contribution would
be coming from the Building Canada
fund, which is only planned to run until 2015.
In addition to
funding the new Transit plan the City has an obligation to invest in the
renewal of existing assets and expand the transit system into new
subdivisions. Included in the model are
capital requirement of $60 million annually for the renewal of existing Transit
systems and assets and $50 million per year for transit growth projects outside
of those included in the Transit Plan.
These requirements have been increased annually by an assumed 3 per cent
rate of inflation.
Under these
assumptions the City can afford from $560 million to $700 million of funding
for the Transit Plan over the next 10 years.
Combined with an equal contribution from both levels of government this
provides for a total plan of between $1.68 billion and $2.1 billion. The difference between the high and the low
of what the City can afford is the difference between how much debt is used,
but at either level there is no requirement to increase taxation in order to
service additional debt. The memo
issued on affordability when the four scenarios were released indicated $2.8
billion was available but as indicated in the memo, that required and increase
in taxation to fund additional debt servicing costs of $35 million.
The roads
identified as being required in the next 10 years have been included in the
draft 2009-2018 capital forecast in the 2009 Budget. Growth roads are 95 per cent funded from development charges so
the total of $791 million would require City funding of $40 million over the next
10 years. Current development charge
receipts for the road component are approximately $40 million per year,
but Council’s Development Charge funding policy allows the roads component to
be managed on a cash basis. As spending
lags behind when the authority is approved, this means that Council can approve
capital authority funded from Development Charges above the amount actually
received as long as the Development Charge account does not go into a
deficit. This would allow these
projects to be authorized as indicated in the plan.
SUPPORTING DOCUMENTATION
Document 1: Development of the
Supplementary Transit Network
Document 2: Review of Alternative
LRT Terminus Locations in Riverside South
Document 3: Options
to Expand the Current O-Train Service to Provide Service on the Local VIA Route
to Fallowfield – Technical Memo
Document 4: Carling Avenue – Technical Memo
Document 5: Key Transfer Stations -
Technical Memo
Document 6: Phasing of TMP Transit Network
Document 7: Operational
Review
Document 8: Risk Assessment Report
Document 9: Road
Infrastructure Needs Study
Document 10: 2008
Draft Transportation Master Plan Document (TMP)
Document 11: Investment
Strategy for Ottawa’s Rapid Transit Network -Terms of Reference For Financial
Tools and Incentives for Transit Oriented Development
Document 12: Phase III
Consultations
Document 13: eConsultation
Report
DISPOSITION
·
Infrastructure Services and Community Sustainability
Department will finalize the TMP to incorporate any changes made by Committees
and Council;
·
Upon the approval of the TMP, incorporate its results
into the Official Plan review process;
·
Infrastructure Services and Community Sustainability
Department in conjunction with City Manager’s office will prepare funding
submission to senior level of governments, including necessary studies and
business plans, for Increment 1 transit projects.