Compensation
Compensation costs represent the single largest component of the City's operating budget. Managing compensation costs is one of the most challenging issues for Ottawa and other large Canadian municipalities for a number of reasons:
- A highly unionized workforce and collective bargaining settlements that are often beyond the rate of inflation put real pressure on municipal budgets.
- Unions continue to negotiate for stronger benefits packages, while the City is grappling to pay for increases in the cost of providing existing benefits that far exceed the Consumer Price Index.
- Wage settlements are heavily influenced by settlements across Ontario, particularly in the Toronto area. Increases in compensation costs may also be influenced by settlements imposed by provincial arbitrators.
- The City of Ottawa is the second largest employer in the city, after the federal government, and must compete against other levels of government and the private sector for resources in the same talent pool. Attracting employees with similar education and work experience requires that salaries and benefits packages remain competitive.
Employment figures at the City of Ottawa
The number of Full-Time Equivalent positions (FTEs) at the City changes every year in response to increased demand for services from a growing population, implementation of new programs by Council or changes to provincial legislation.
For example, the City had 13,003, 12,755 and 13,139 FTEs for 2003, 2004 and 2005, respectively. These numbers include the Ottawa Police Service and the Ottawa Public Library and represent positions, not employees.
A single FTE can represent more than one position if the positions are casual or part-time. For example, a part-time position in Parks and Recreation may be equivalent to 0.08 FTEs; a seasonal position in the Public Works department (e.g., involving the operation of snow-clearing equipment) could equate to 0.4 FTEs; and a full-time public health nurse would be 1.0 FTEs. Therefore, multiple employees can be associated with one FTE.
The City manages scheduling and payment of wage employees on an hourly basis. For budget purposes, the yearly total of wage employee hours, or wage pool, is converted to FTEs. However, the type of work performed and the associated hourly rates vary seasonally and annually, especially during changeovers in the spring and fall.
Each summer, there is a significant increase in the number of employees due to the student employment program. The total number of employees is also influenced by factors such as resignations, retirements and completion of temporary work terms. These variations mean that the total number of employees is much higher than the total FTE count, and more importantly, that the number is not static.
On average, 17,000 employees work for the City each year. In 2006, the total number of employees varied from a low of 16,135 in January to a high of 17,675 in July; the number of FTEs, on the other hand, remained relatively constant over that period.
Council's Delegated Authority By-law places strict controls on the number of FTEs at the City. Council must approve any increase to the total number of FTEs for both full- and part-time work. Monthly reports showing current FTEs and the total number of employees at the City allow Council to track changes.
Employee compensation
Total spending on compensation, including the Ottawa Police Service, was $913 million in 2004, and $941 million in 2005. In addition to base salaries, employee compensation includes elements such as:
- One-time compensation payments awarded as retroactive collective agreement settlements
- One-time cost adjustments for items such as pay equity or reclassifications
- All premiums (governed by collective agreements)
- One-time compensation costs as a result of grievances or arbitration decisions
- Benefits costs
Excluding these elements, base salaries paid to City employees totalled approximately $673 million in 2004 and $706 million in 2005.
How Ottawa compensation costs compare to other municipalities The majority of municipal employees are unionized. Pay scales for unionized positions are set through collective agreement(s) and the job evaluation process. Changes to a position's base salary range are negotiated as part of collective bargaining. Annual increases at the City of Ottawa are comparable to those in other large municipalities. The table below compares wage settlements for the City of Ottawa's unionized groups with wages in a selection of other municipalities.
Economic increases, by municipality (largest union), 2001-2005
| Municipality | 2001 | 2002 | 2003 | 2004 | 2005 |
|---|---|---|---|---|---|
| Ottawa | 2.50% | 2.75% | 3.00% | 3.00% | 3.00% |
| Mississauga | 2.50% | 2.50% | 2.50% | 2.50% | 3.00% |
| Calgary | 3.50% | 3.50% | 3.00% | 3.50% | 3.50% |
| Edmonton | 3.00% | 3.00% | 3.00% | 3.50% | 3.50% |
| Brampton | 2.50% | 2.50% | 2.50% | 2.50% | 3.00% |
| Winnipeg | 2.50% | 2.00% | 3.00% | 3.00% | 3.00% |
| Hamilton | 2.00% | 2.00% | 3.85% | 2.83% | 2.25% |
| London | 2.30% | 2.30% | 3.00% | 3.00% | 2.90% |
| Vancouver | 2.50% | 2.50% | 2.50% | 3.00% | 2.50% |
| Toronto | 3.20% | 3.00% | 3.00% | 3.00% | 2.75% |
| Durham | 3.00% | 3.00% | 3.00% | 3.00% | 3.00% |
| Niagara | 2.00% | 3.00% | 3.00% | 3.00% | 3.00% |
| Halton* | 3.00% | 9.00% | 2.50% | 4.90% | N/A |
| York | 2.10% | 2.20% | 2.90% | 3.00% | 3.00% |
| Average | 2.62% | 3.12% | 2.90% | 3.13% | 2.95% |
| Median | 2.50% | 2.50% | 3.00% | 3.00% | 3.00% |
| 75th percentile | 3.00% | 3.00% | 3.00% | 3.00% | 3.00% |
A number of factors influence salaries paid to City employees:
- The scope of responsibilities and the specific job duties of the position
- The education, experience, certification and knowledge required to qualify for the position
- Whether the position is unionized
- Whether the pay grade for the position is influenced by the City's pay equity plan
- Whether exceptional market demand for the experience, education, skills or training required for the job results in problems attracting and retaining qualified candidates
The City monitors salaries and benefits and compares them to similar positions at public and private sector organizations in Ontario and across Canada. Overall, results for Ottawa compare favourably to other municipalities.
Many management positions are compensated below the median rates Current and past surveys and studies conducted by local and national compensation specialists, such as Mercer Human Resources Consulting, indicate that unionized City positions tend to pay the same as or slightly better than those in the private sector. However, the surveys also show that some specialized technical positions, as well as many management positions, are compensated below the median rates paid in the public and private sectors. This trend becomes more pronounced at more senior levels within the organization.
Comparisons to other large municipalities provide one perspective on how Ottawa's salaries fare. However, the City of Ottawa hires the majority of its employees from the local labour market, and therefore compensation must compete with that offered by other employers in the area, particularly the federal government.
In 2005, Council set a policy to limit pay increases for the management and professional exempt group to increases in the Ottawa Consumer Price Index. The intent was to send a clear message to residents and City unions that Council was concerned about budget pressures associated with compensation costs. The City has a policy that management salaries should be within the 75th percentile when benchmarked against other major Canadian cities, including Brampton, Mississauga, Hamilton, London, Windsor, Calgary, Edmonton, and the Regions of Durham, Halton, Niagara, Peel, Waterloo and York. Management salaries were at the 75th percentile in 2002. The City is awaiting 2006 Mercer survey results for current data on management salaries.
Approximately 95% of the City's workforce is unionized. Amalgamation reduced the number of collective agreements inherited from the former municipalities from over 50 to 11, not including the Ottawa Police Service.
Ottawa's largest bargaining agent is the Canadian Union of Public Employees (CUPE), which represents six groups for a total of more than 8,000 City employees:
- CUPE Local 503 - Inside/Outside workers
- CUPE Local 503 - Library
- CUPE Local 503 - Part-time (Recreation and Culture)
- CUPE Local 5500 - Transit Fleet Maintenance
- CUPE Local 5500 - Transit Supervisor
- CUPE Local 5500 - Transit Security
The other five bargaining agents include:
- Amalgamated Transit Union (ATU) Local 279
- Amalgamated Transit Union, Local 1760
- Civic Institute of Professional Personnel (CIPP)
- Ottawa Professional Fire Fighters Association (OPFFA), and
- International Alliance of Theatrical Stage Employees (IATSE), Local 471
There are collective agreements in place for all of these groups, covering terms The impact of collective bargaining from one to three years, with staggered expiry dates. Therefore, the City is almost always in active collective bargaining with one or more of these groups.
Each collective agreement covers three areas:
- Wages
- Benefits
- Working conditions
City Council approves the negotiating mandate prior to any discussions regarding monetary issues in the collective bargaining process. While the City makes every effort to negotiate an agreement at the bargaining table, there are instances when this cannot be achieved. Most of the bargaining groups at the City have binding arbitration as the dispute resolution mechanism. The exceptions to this include ATU 279, CUPE 5500 and CUPE 503 Library, which have strike provisions in their collective agreements.
Binding arbitration preserves the operation of City services if the parties cannot reach a new agreement, and prevents work stoppages that could result if a strike provision were included in these collective agreements.
The City's experience shows that arbitration does not necessarily produce higher settlements than those negotiated at the collective bargaining table or through strike action. In general, wage settlements at the City are comparable to those in other large Ontario municipalities.
Collective agreement settlements, new City of Ottawa
The table below depicts the wage settlements for bargaining groups at the City of Ottawa since amalgamation and compares them to the CPI| Year | MPE | CUPE 503 (Inside / Outside) | Civic Institute of Professional Personnel | ATU 279 | ATU 1760 | CUPE 5500 | CUPE Library | Part Time Rec & Culture | Fire | IATSE | Police - Civilians | CPI Ottawa | CPI Ontario | CPI Canada |
| 2008 | 3.00% | |||||||||||||
| 2007 | 3.00% | 3.00% | 3.00% | |||||||||||
| 2006 | 2.30% | 3.00% | 3.00% | 3.00% | 3.00% | 3.00% | 2.75 | 3.00% | 2.96% eff. inc.** | |||||
| 2005 | 2.20% | 3.00% | 3.00% | 3.00% | 2.20% | 3.00% | 2.25% | 3.00% | 3.640% | 2.3% | 2.2% | 2.2% | ||
| 2004 | 2.50% | 3.00% | 3.00% | 3.00% | 3.00% | 3.00% | 3.00% | 3.00% | 3.00% | 3.632% | 1.9% | 1.9% | 1.9% | |
| 2003 | 3.00% | 1. 3.00% 2. Harmonize | 1. Harmonize 2. 2.50% 3. 6th step added | 3.00% | 3.00% | 3.00% | 2.50% | 2.75% eff. inc.** | 4.47% eff. inc.** | 2.75% | 3.885% | 2.5% | 2.7% | 2.8% |
| 2002 | 2.50% | 2.75% | 1. 3.60% lump sum 2. - T4 earnings 3. 5.00% | 3.00% | 2.75% | 3.00% | Harmonize | 1. 2.00% lump sum 2. (Jan-Aug) 3. 2.00% 4. Harmonize rates | 3.31% eff. inc.** | 2.50% | 3.33% eff. inc.** | 2.2% | 2.0% | 2.2% |
| 2001 | 2.50% | 2.50% | 3.60% lump sum - T4 earnings | 2.00% | 2.50% | 2.00% | 3.00% lump sum | 3.00% lump sum | 1. Harmonize 2. 2.5% | 2.51% eff. inc.** | 3.2% | 3.1% | 2.6% | |
| 2000 | 2.38% eff. inc.** | 2.25% eff. inc.** | 2.38% eff. inc.** | 2.00% | N/A | 2.00% | 1 | 1 | 1 | 1 | 2.52% eff. inc.** | 3.0% | 2.9% | 2.7% |
Notes:
1. Function not at the regional level - owned by the amalgamating municipalities.
* Collective agreements can be effective throughout the calendar year.
** Effective increase (eff. inc.) indicates where there has been more than one pay increase applied in a calendar year (e.g. one in January and one in July). In scenarios such as this, the second pay increase must be compounded onto the first pay increase.
Like other Ontario municipalities, Ottawa must often accept wage decisions made by arbitrators where it is clear that the amount of the increase is directly related to awards made in the Greater Toronto Area. The significant costs that result for the City from this practice are particularly evident in agreements for fire, police and ambulance workers across Ontario.
Employee benefits are the second major compensation cost for the City. Benefits costs are rising
The City has taken several steps since amalgamation to control the escalating costs of providing and administering benefits, including:
- Consolidating benefits with fewer providers to reduce administrative overhead and administrative costs
- Implementing self-insured long-term disability coverage rather than using an external provider, to reduce annual costs
- Externally administering self-insured benefits to lower administration costs
- Negotiating similar benefits in collective agreements to reduce the complexity and cost of providing benefits
- Minimizing the number of additional benefits negotiated into collective agreements
Despite gains from these measures, all employers across Ontario have experienced hyper-inflationary increases in the cost of providing benefits. At the time of amalgamation in Ottawa, the average cost of providing employee benefits was about 15% of base salaries. This cost has increased to nearly 23.5%, primarily to cover increases in basic premiums. Specific payments such as long-term disability costs have increased by 42% during this period.
Benefit costs also include the employer's share of the Ontario Municipal Employee Retirement System (OMERS) pension plan. At the time of amalgamation, a contribution holiday was in effect for both employers and employees. Premiums were later reintroduced and the OMERS Board approved an increase to the current level of 6.5% for earnings up to the yearly maximum pensionable earnings (currently $42,100) and 9.6% on earnings above that threshold for employees with a normal retirement age of 65. Employers must match the employees' premiums.
The decision to move to a self-insured model for long-term disability was a direct result of the significant cost increase in providing this benefit through an external insurance carrier between 2005 and 2006.
Several major factors have influenced staffing level changes since amalgamation. Reductions in staffing levels have occurred because of amalgamation savings and Universal Program Review while legislated and mandated changes and population growth have increased staffing levels.
Prior to amalgamation, the 12 former municipalities' total FTE count was 12,786. Since then, Ottawa has reduced the number of FTEs in all program areas. FTE savings attributed to amalgamation took place primarily within a three-year period, and yielded a reduction of 665 FTEs, or 5.2% of the original number of FTEs of the amalgamated city.
In 2004, the Universal Program Review and corporate reorganization resulted in an additional reduction of 483 FTEs, or 3.8% of the original number of employees. A similar exercise in 2006 yielded a further reduction of 88 FTEs.
Changes in City staffing since amalgamation. From 2001 to mid-2006, provincially and federally funded programming, as well as legislated and mandated changes, increased the number of FTEs by 586, or 4.6% of the original complement. Major changes included the provincial downloading of paramedic services (388 FTEs) and provincially funded housing, long-term care and public health programs (108 FTEs).
The City of Ottawa has also experienced significant growth in population and infrastructure since amalgamation. As a result, 1,332 FTEs have been added, or 10.4% of the original complement. Key contributors include growth in public transportation affecting transit services and fleet services (376 FTEs) and the Police Service's Strategic Staffing Initiative (310 FTEs).
The net effect of these changes is an overall increase in FTEs since amalgamation of 682 (which includes 306 additional Ottawa Police Service FTEs), or 5.3% of the 2000 year-end complement, which were approved by City Council.
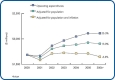
The graph below reflects the effect of these changes. While staffing levels have risen slightly over the period, there has been an overall decline in staffing levels per thousand residents since 2000. In 2000, there were approximately 16.2 FTEs for every thousand residents; in 2006 there are 15.5 FTEs for every thousand residents.

The increase of 682 FTEs since amalgamation includes 306 FTEs for Police Services. If the Police increases are removed, the remaining increase of 376 FTEs can be split into administrative and operational positions. Overall, there were 743 operational positions created and 367 administrative positions eliminated over the 2001 to 2006 time period.
The graph below represents the changes in operational and administrative FTEs since amalgamation, excluding police.

In 2005, the City of Ottawa's first Human Resources (HR) Plan was tabled with Council. The Plan reported on FTE allocations and forecast future requirements based on operational needs. It also provided information about the resourcing of key City functions. The next HR Plan will be tabled in 2007 in conjunction with the City of Ottawa's budget process.
Council-controlled programs
Council Controlled Programs
Ottawa's Council directly controlled 58% of the total gross 2006 budget, amounting to $1,217 million in gross expenditures. Overall, in 2005 Ottawa spent approximately $3,184 per household, which is $1,052 less than Toronto and $223 less than the seven-city average primarily because of slightly lower spending on water and sewer programs. Details on the various Council-controlled programs follow.
Total Council-controlled spending, per household

In 2005, the five most expensive Council-controlled programs, on a gross per household basis, were transit services, transfers to capital, fire services, recreational programs and facilities, and general government. The spending comparisons for these areas are shown in the following graph.
Per household spending comparisons, 2005

Ottawa's spending is comparable to major Ontario cities
Transit services are Ottawa's largest Council-controlled gross expenditure. Ottawa spends approximately $730 per household on transit services. This is significantly higher than the seven-city average, which includes municipalities without extensive public transit systems. However, Ottawa spends less than Toronto, on a per household basis for transit, which would be expected, given the Toronto transit system's size and the number of riders.
As shown below, Toronto's net expenditure for transit is much less than Ottawa's, for several reasons. For example, Toronto is able to recover 81% of its transit costs from user fees and provincial grants, with the largest portion coming from user fees. In 2005, Toronto's user fees covered 72% of the cost. The same year, Ottawa's user fees covered only 45% of the direct operating costs. Ottawa City Council has since adopted a policy to collect 55% of direct operating expenditures from user fees.
In addition, Toronto is able to use its entire provincial gas tax allocation to pay transit operating costs whereas Ottawa only uses a portion of it for growth-related operating costs. Toronto is able to use all of the provincial gas tax for operating costs as they receive more capital transit grants than Ottawa; therefore, they do not need to use the provincial gas tax for capital costs.
The Province of Ontario stopped providing transit operating grants in 1997. As a result, Ottawa must now fund 54% of transit service costs from the property tax bill, while Toronto has to fund only 19%.
Transit services expenditure comparison

Ottawa's second largest Council-controlled expense is transfers to capital. These are annual transfers to capital reserve fund accounts, to be used to cash finance capital expenditures. Ottawa currently spends less per household than Toronto and the seven-city average on transfers to capital. Lower spending on transfers to capital reflects Ottawa's decision to fund more capital projects with debt than other municipalities. When debt servicing is added to the contribution to capital for tax-supported capital projects, Ottawa's spending is higher than Toronto's and approximately 15% less than the seven-city average. However, Ottawa's overall expenditures will likely rise in the future since Council has approved a policy to increase contributions to capital by the rate of the Infrastructure Construction Price Index as calculated by Statistics Canada.
Fire services, and recreational programs and facilities are the next largest expenditure in Ottawa. City spending is similar to Toronto's and the seven-city average for these services.
Ottawa's general government expenditures, which include functions such as Council, the City Manager's office, the Deputy City Managers' offices, the Auditor General, the City Clerk's office and Client Services and Public Information, are slightly higher than Toronto's and the seven-city average. Unlike the other cities, Ottawa uses a "centre of expertise" organizational structure. As a result, costs that would normally be found in individual branches in a decentralized organization are allocated to the general government category. Toronto and the seven cities have not generally adopted this centralized approach, which explains why Ottawa's costs appear to be higher.
The remaining major service costs controlled by Council are shown in the following graph. These include roadways and street lighting, winter control services, recycling, waste and disposal services, libraries and planning and zoning services.
Per household spending comparisons, 2005

Ottawa's costs for roadways and street lighting - approximately $208 per household - are similar to, but slightly higher than Toronto's costs, and lower than the cost in the seven-city average. Winter control spending in Ottawa (snow ploughing and removal), is approximately $164 per household, which is higher than Toronto and the seven-city average. This reflects the differences in climate (more snow and freezing rain) and geography, as well as differing service decisions in the various municipalities.
With four disposal sites across the city (two privately operated and two City-operated), Ottawa spends much less for recycling, waste and disposal than Toronto, which has no local disposal facilities and therefore incurs greater shipping costs to dispose of its waste.
Spending per household on library services, and land planning and zoning services is fairly equivalent between Ottawa, Toronto, and the seven-city average. Because Toronto is more developed, its spending on planning services is slightly lower than that of the growing cities in the seven-city average.
Council also controls expenditures for parks, protective inspections and controls, cultural services and parking. Household spending comparisons are shown in the following graph.
Per household spending comparisons, 2005

Ottawa spends less than Toronto and the seven-city average on parks, protective inspection and controls, and cultural services. Parking expenditures per household are between Toronto's and the seven-city average.
At approximately $37 per household, Ottawa's cultural services costs are comparable to the seven-city average. Toronto spends far more on cultural services. In 2003, Toronto adopted the "Culture Plan for the Creative City," which provides for spending in cultural services to dramatically increase over five years, with a $2 per capita increase annually.16
In 2006, Ottawa City Council endorsed the creation of an Arts Investment Steering Committee to help position Ottawa as a competitive, creative city. The Committee, which is investigating investment strategies to close the revenue gap for Ottawa's local arts and festival sector, is expected to present its report to Council before the end of 2007.
Management of debt
Another program controlled by Council is the management of debt. As seen in the following graph, Ottawa spends approximately $326 per household on debt charges, including principal and interest payments on liabilities such as the issuance of debt (debentures), term bank loans and sinking funds. These debt repayment charges are funded from taxation and the water/sewer bill. Long-term debt finances municipal capital projects within the City.
Per household debt spending comparisons, 2005

Since 2001, the Long-Range Financial Plan process (LRFP I and II) has been used to assess the capital infrastructure needs to help meet the projected lifecycle and population growth requirements of the city. To achieve Council goals, LRFPs employ a combination of financing tools, including development charges, funding from other levels of government, transfers from the capital reserve funds and the issuance of debt.
Since provincial legislation does not permit municipal governments to finance operating deficits through debt, the City only borrows money for capital works such as roads, water and sewer systems, buildings and transit projects.
Why the City uses debt financing
Council requires that capital assets financed by debt have a useful life at least as long as the term of the debt. The actual terms and structure of debt financing vary with market conditions; however, debt is generally issued for 10 or 20 years. Longer debt terms are sometimes undertaken for capital programs with substantially longer useful lives such as the Light Rail Transit project. When required, debt is considered an appropriate way of financing longer-life items since future taxpayers who benefit from the project pay for it through future debt charges. To achieve the lowest borrowing costs, the City usually seeks debt financing in the Canadian public financial market.
The City has adopted the practice of maintaining tax-supported debt charges within a "budget envelope." Thus, as older debt matures, new debt is issued and the amount of debt charges (principle and interest repayments) collected through taxes remains relatively constant.
Since amalgamation, the City has benefited from lower interest rates and issued new debt at much lower interest rates than in earlier years. This has allowed the City to service more debt at a lower cost. As shown in the following table, the cost of tax-supported debt as a percentage of the tax requirement has fallen significantly since amalgamation.
Tax-supported debt compared to the net tax requirement, $ thousands
| 2000 | 2001 | 2002 | 2003 | 2004 | 2005 | 2006 | |
|---|---|---|---|---|---|---|---|
| Tax-supported debt charges | 70,927 | 72,524 | 65,135 | 65,206 | 74,336 | 67,695 | 72,561 |
| Total property tax revenues | 746,521 | 777,859 | 805,484 | 826,484 | 864,494 | 919,747 | 953,498 |
| Cost of tax-supported debt as percentage of tax requirement | 9.50% | 9.30% | 8.10% | 7.90% | 8.60% | 7.40% | 7.61% |
The next table shows that total issued net debt17 is expected to increase over the next four years to $912 million. This increase aligns with the recommendations adopted in LRFP II, and is largely due to the increase in gas tax and other revenue-supported debt. Approximately $196 million of the projected $912 million stems from debt issued for the Light Rail Transit project. The debt will largely be paid through financing from other levels of government and development charges.
Net issued debt by revenue source, $ millions
| 2006 | 2007 | 2008 | 2009 | 2010 | |
|---|---|---|---|---|---|
| Tax-supported | 469 | 471 | 463 | 463 | 466 |
| Rate-supported | 73 | 96 | 123 | 144 | 170 |
| Other revenue-supported | 0 | 125 | 242 | 260 | 276 |
| Total | 542 | 692 | 828 | 867 | 912 |
The Province regulates the amount of debt municipalities issue by setting an annual repayment limit for each municipality. This is the maximum amount by which a municipality may increase its debt and other financial obligations in the following year. The repayment limit is set at 25% of a municipality's net own-source revenues, including taxation, user fees and any other non-provincial or federal funding. The repayment limit imposed by the Province on the City of Ottawa is $293 million - representing the maximum amount of debt charges (principal and interest repayments) to be incurred annually. This would allow the City to issue up to $3.1 billion in new debt depending on the terms and conditions of the debt.18
City debt servicing is well below provincial limits
Although Ottawa's current and projected debt is well below the provincial limit, if it were to reach the limit, future operating budgets would be severely constrained or tax and other revenues would have to increase significantly.
The City of Ottawa is not alone in forecasting rising levels of debt due to long-term capital expenditures. A research report on the finances of Canadian municipalities issued by Standard & Poor's in May 2006 states that:
"across all rating categories and steadily since 2001, debt and debt burdens have been increasing…it is increasingly evident that rated municipalities are overcoming their historical aversion to debt as they address their substantial infrastructure deficiencies."
The difference in Ottawa is that future increases in debt are to be funded from non-tax sources of revenue, thereby ensuring that the City's taxation remains fairly flexible.
16"Cultural Plan for the Creative City," City of Toronto, 2003, pg. 6.
17Net debt is defined as the total debt outstanding less the amount of any sinking funds. For certain types of debentures, the Municipal Act requires the City to set aside a sum of money each year, which will accumulate to the total principal amount of the debenture payable on maturity.
18The provincial limit sets the maximum amount available to service debt charges. Thus the amount of new debt that could be issued will vary with the term selected and the interest rates at the time.
Expenditure overview
Expenditure Overview
Ontario municipal budgets include numerous programs and services that are provincially mandated but paid for through property taxes. As a result, there are many required expenditures over which Council has very little control. Ottawa's 2006 annual operating budget for tax-supported programs and services can be divided into the following categories:
- Provincially mandated or cost-shared programs
- Police Services Board
- Debt repayments
- Council-controlled expenditures
Breakdown of operating expenditures - 2006 gross operating budget ($2,113M)

Provincially mandated or cost-shared programs
The Province has established programs for a variety of services such as social assistance, social housing, child-care, public health and many others. When these programs were set up, the province set the regulations, established the cost-sharing formula, and then required the City to administer these programs on its behalf. Almost one-third of City spending is directed to provincial programs.
Over the years, the level of provincial funding based on cost-sharing formulas has deteriorated. Expenditures that were originally eligible for cost-sharing are now deemed ineligible. As service costs grow, funding caps cover a smaller proportion of these expenditures and municipal property tax funds have to make up the shortfall.
Police Services Board
Comprising Councillors and appointed members of the public, the Police Services Board oversees the police department and makes independent decisions about the priorities and needs presented to Council. The Police Services budget represents 9% of gross City spending. Council can either reject or approve the budget in its entirety, but cannot review or amend the budget on a line-by-line basis. If the Police Services Board does not agree with the Council decision, it can appeal the decision to a provincially administered body.
Debt repayment
Expenditures for interest and principal repayments of previously issued debt represent 4% of overall City expenditures. These repayments are for a fixed amount and time and it is not within Council's ability to adjust them during the yearly budget-setting process.
Council-controlled expenditures
The remaining 58% of the City's expenses fall under City jurisdiction and the decision-making authority of City Council. These areas include:
- Rate-supported programs: expenditures for the provision of potable water and sanitary/ storm sewer services, funded by revenues from water and sewer surcharge rates.
- Tax-supported programs: expenditures for "traditional" municipal programs such as summer/winter road maintenance, public transit, fire services, garbage collection and parks and recreation. User fees are used to reduce the costs associated with some of these programs with the remainder funded through property taxes.
- Contribution to capital: yearly transfers to capital reserve funds to maximize cash financing of the City's tax- and rate-supported capital programs and minimize debt financing.
Unlike the Police Services budget, Council can approve expenditures for Library Services. The independent Library Board, composed of Councillors and appointed residents, proposes a budget that Council has the authority to review and adjust on a line-by-line basis. Library Services are therefore included under Council-controlled expenditures.
Spending increases since amalgamation
The City's operating budget has increased by 25.3 % since amalgamation. When these increases are adjusted for increases in the population, the increase is 13%. When these increases are adjusted for both population increases and inflation, overall City spending has declined by 2.2%.
City spending on operations
How does Ottawa compare?
A review comparing Ottawa with Toronto, and the average of seven major Ontario municipalities, was conducted using the actual expenditures and revenues as reported in the 2005 provincially mandated Financial Information Return.
The seven Ontario municipalities included:
- Peel Region / lower tier municipalities
- York Region / lower tier municipalities
- Halton Region / lower tier municipalities
- Niagra Region / lower tier municipalities
- Durham Region / lower tier municipalities
- Hamilton
- London
When comparing total spending on a per household basis across the province, the City of Ottawa ($5,898) spends less than Toronto ($7,636), but slightly more than the seven-city average ($5,667). This type of peer-to-peer comparison of spending and revenue will be further broken down within this document.
Total spending, per household, 2005 - By category

City services - Citizen Satisfaction Survey Report (EKOS Survey)
In 2004, as part of a new public consultation strategy for its revised annual budget process, City Council agreed to develop an annual residents' satisfaction survey. The goal was to produce a baseline measurement for tracking future changes and to provide Councillors and staff with additional information on a range of service- and policy-related issues.
The telephone survey included a random, representative sample of 1,000 residents (18 years of age or older), with a larger than typical proportion of residents in the rural areas to adequately represent each of four regions of the city. Survey results are considered to be accurate within three percentage points, 19 times out of 20.
The survey showed that while residents were pleased with City services and want to see them maintained or expanded, they do not want to pay more property taxes to maintain the current levels of service.
Produced by EKOS Research Associates, the survey report examined residents' satisfaction with City services, service priorities and funding options for services. The following 17 service areas were included.
| Fire Services | Social Housing and Shelters |
| Paramedic Services | Library Services |
| Police Services | Economic Development Services |
| Garbage and Recycling Services | Parking and Traffic Management |
| Road and Sidewalk Maintenance and Snow Removal | Land-use Planning, Zoning and Building Permits |
| Public Health Services | Child-Care Services |
| Transit Services | By-law Services |
| Parks and Green Space Maintenance | Cultural Programs |
| Recreational Facilities and Programs |
This survey resulted in three high-level conclusions.
1) Residents were relatively satisfied with the performance of the City in providing services
Eighty per cent of Ottawa residents said they were satisfied with the overall level of service they received in 2004. Urban and suburban residents were more satisfied than rural residents. As a result of this survey, the City embarked on the 2005 Rural Summit process. There is now a City branch for Rural Affairs, with dedicated staff and many specific action items that are being implemented.
Overall satisfaction with City services
"Thinking more generally, how satisfied would you say you are with the overall services that are provided to you by the City of Ottawa?"
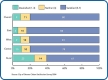
2) Residents value City services and want them maintained or expanded.
The results showed clearly that an overwhelming majority of residents want services maintained or increased. Only a small minority of survey respondents felt that services should be reduced. Each of the 17 individual service areas examined in the study was considered to be important to a large majority of city residents. Emergency services topped the list, followed by garbage and recycling, road and sidewalk maintenance and snow removal, and public health. Virtually all residents indicated they would like to see the City increase or at least maintain current service levels in all 17 areas.
Level of service

3) Residents do not want property taxes to increase.
Despite high satisfaction with services and a desire to see spending on programs and services maintained, half of the respondents did not support a tax increase, while half only moderately supported the idea. This is not unexpected, but it points out a fundamental conflict between the value and importance of City services and the willingness to pay more to maintain current levels of service.
Municipal tax rates
"To what extent would you support an increase to your municipal taxes in order to fund the increased cost of delivering the same level of services that you have right now?"

Liabilities (expenses) incurred for services provided in future
Liabilities (Expenses) Incurred for Services Provided in Future
Some of the expenses, or liabilities, the City incurs do not have to be paid immediately. For example, the City could enter into a contract with a union to provide benefits to members after they retire. This liability would increase every year until the union members retired.
Since 2000, municipalities have been required to prepare their financial statements in accordance with accounting policies set out by the Public Sector Accounting Board (PSAB), an independent body with the authority to set accounting standards for the public sector. The 12-member governing board comprises federal, provincial and local government accountants, auditor generals, public auditors, budget officials and academics. PSAB's mission is to set standards and provide guidance for public sector financial and other performance information.
Under PSAB policies, employee benefits must be recorded in financial statements at the time they occur, as a liability to be paid in the future.
The City's employee benefits liability is made up of four categories: post-retirement benefits, post-employment benefits, Worker Safety Insurance Board (WSIB) obligations, and vacation leave. Post-retirement benefits include health care, dental care and life insurance. Post-employment benefits are made up of accumulated sick leave payouts and continuation of benefits while an employee is on long-term disability.
PSAB deems each of these categories to be employee benefits, and all must be reviewed to determine the ongoing liability to the City. This liability is shown as employee benefits in the liabilities section of the City's Consolidated Statement of Financial Position (see page 60 of the 2005 City of Ottawa Annual Report).
The City funds post-employment and post-retirement benefits on a cash basis. As a result, employee benefits are included in the budget as the value of the payments to be made in a given year. As the City's workforce ages and retires, the cash payments for these benefits are steadily increasing, which will cause significant budget pressures in the future.
To lessen the impact of these future budget increases and ensure that those who receive the services today pay the full cost, the City is developing a 10-year plan to move from a cash basis to an accrual accounting basis for these liabilities. With this plan, the liability will be paid out of the budget in the year it is incurred rather than the year it is paid out. If the City does not implement such a plan, significant budget increases will be required in the years when these liabilities have to be paid.
Landfill closure liability
The City of Ottawa provides garbage collection and disposal services to residents and businesses and operates two landfill sites for this purpose. When these sites reach capacity and are closed, the City will continue to be responsible for their ongoing maintenance under the Ontario Environmental Protection Act. Post-closure care for these sites (and other inactive sites) is expected to last approximately 25 years. The PSAB requires the City to record the estimated liability in its financial statements.
In 2005, the value of this future cost was estimated to be $10.8 million; this figure will increase every year until the landfills close. Based on the principle that those benefiting from the landfill today should pay for its future closing costs, City Council has included a provision for landfill closure and post-closure costs as part of the new user-pay structure for solid waste management.
Operating reserves
Municipalities ensure that essential services like water, sewer, snow clearing, emergency response and many others are reliably available to residents year-round. There are years, however, when municipalities face unanticipated and unavoidable costs in delivering these services. In Ottawa, for example, unpredictable and severe winter conditions and the possibility of emergency situations can affect yearly spending.
Cities establish operating reserve funds, similar to a household "rainy day" fund, to cover these unforeseen costs and to avoid having to resort to tax increases in any given year. For example, some cities create an insurance claims reserve to cover the cost of claims that exceed the yearly budgeted amount. Reserves are typically funded from budget surpluses or through regular contributions from the operating budget.
Municipalities also require funding for special "one-time-only" projects or programs that are only active for a short period. For example, Ottawa's elections reserve is funded through a yearly tax contribution and used every four years to cover municipal election costs.
At amalgamation, the City of Ottawa created operating reserve funds with combined balances of approximately $54.5 million. Since then, these funds have been used, as designed, to mitigate funding pressures that would have otherwise resulted in service reductions or deferrals, or higher property tax increases.
The City of Ottawa has five operating reserves to offset expenditure fluctuations:
- Self-insurance
- Vested benefits
- Tax stabilization
- Elections
- Winter maintenance
With the exception of the elections reserve, which is funded from a yearly tax contribution, the remaining reserves are funded from budget surpluses or one-time, Council-approved funding.
Because provincial law dictates that municipalities must table balanced budgets - unlike the two other levels of government - a budgeted deficit is not allowed. The Tax Stabilization Reserve was established at amalgamation to cover expenses that cannot be forecast. This reserve, which is funded from previous year surpluses and any special contribution Council decides to make, can be drawn upon if the City incurs a deficit in any given year.
At the end of 2005, Ottawa had $13.1 million in operating reserves. Rather than directing more funds to the reserves, Council has instead adjusted the budget every year to try and ensure that sufficient funds are available to continue to provide appropriate levels of service. For example, when the winter maintenance reserve was depleted in 2002, Council increased the winter maintenance budget to reflect the average spending of the past three years. This increased funding should reduce the City's need to resort to reserves and absorb potential increased costs due to weather.
It is prudent financial management to either adjust the budget or replenish operating reserve funds each year. Because the municipality cannot incur a deficit, the only other source of funds is the city-wide capital reserve fund. Yearly contributions are made to this reserve fund from property tax revenues to provide funds to cash finance the City's capital program. However, repeated withdrawals from this reserve reduce the City's ability to fully fund priority capital projects in the following year.
Ottawa Police Service finances in context
Every Canadian municipality providing police services reports that these costs constitute one of the biggest financial commitments in the annual budget and resulting tax rate. The Ottawa Police Service (OPS) represents 16% of the total 2006 City property tax bill, excluding education - $404 for an average residence with an assessed property value of $276,245. On a cost-per-service basis, transit is the only City cost exceeding the cost of policing.
The Ottawa Police Service gross budget has increased in the past few years; increases can be attributed mainly to added costs for contract personnel and growth in the number of officers required. Gross annual budget increases since amalgamation in 2001 are presented in the table below.
OPS gross budget, 2001 to 2006
| 2001 $ thousands | 2002 $ thousands | 2003 $ thousands | 2004 $ thousands | 2005 $ thousands | 2006 $ thousands | |
|---|---|---|---|---|---|---|
| OPS operating budget - total gross expenditures* | 128,761 | 137,130 | 144,279 | 158,427 | 174,670 | 189,167 |
| % Annual increase | 6.5% | 5.2% | 9.8% | 10.3% | 8.3% |
As presented in the next table, while gross spending has increased over this period, most increases have been proportional with the total City budget. Since 2003, the proportional police share of the total City budget has increased from 7.8% to 9%.
OPS gross budget in proportion to total City budget
| Gross operating budget | 2001 $ thousands | 2002 $ thousands | 2003 $ thousands | 2004 $ thousands | 2005 $ thousands | 2006 $ thousands |
|---|---|---|---|---|---|---|
| City operating budget | 1,681,519 | 1,726,046 | 1,838,862 | 1,898,290 | 1,988,385 | 2,113,224 |
| OPS operating budget* | 128,761 | 137,130 | 144,279 | 158,427 | 174,670 | 189,167 |
| OPS as % of total city | 7.7% | 7.9% | 7.8% | 8.3% | 8.8% | 9.0% |
Even with proportionately greater increases in recent years, OPS spending compares favourably with other municipalities in Ontario. For example, spending on police services in Toronto represents 10%19 of gross municipal spending.
The most recent police costs published by Statistics Canada in 2005 show that, on a per capita basis, Ottawa falls in the middle of a selection of 12 Canadian municipalities.
Police costs, per capita
| Service | Cost ($) | Rank |
|---|---|---|
| Toronto | 284 | 1 |
| Vancouver | 282 | 2 |
| Edmonton | 257 | 3 |
| Montréal | 236 | 4 |
| Calgary | 231 | 5 |
| OTTAWA | 204 | 6 |
| Peel | 199 | 7 |
| Hamilton | 196 | 8 |
| Durham | 189 | 9 |
| Gatineau (Urban) | 169 | 10 |
| Halton | 165 | 11 |
| York | 163 | 12 |
Population per police officer is another common measure published annually by Statistics Canada. The most recent statistics from 2004 show that Ottawa falls close to the low end of the ranking, with 1 police officer for every 771 residents.
Population, per police officer
| Service | Ratio | Rank |
|---|---|---|
| Montréal | 482 | 1 |
| Toronto | 492 | 2 |
| Vancouver | 520 | 3 |
| Edmonton | 566 | 4 |
| Calgary | 640 | 5 |
| Peel | 690 | 6 |
| Hamilton | 708 | 7 |
| Gatineau (urban) | 711 | 8 |
| Durham | 757 | 9 |
| OTTAWA | 771 | 10 |
| Halton | 843 | 11 |
| York | 867 | 12 |
The Ottawa Police Service Strategic Staffing Initiative (SSI) has helped increase the number of sworn officers by 90 since 2004. In 2006, there are 1,251 sworn officers in Ottawa serving a population of 870,250 - one police officer for every 695 residents.
19City of Toronto.
Overview of spending by expenditure type
As reported in the provincially mandated Financial Information Return (FIR), Ottawa's total operating and capital expenditures in 2005 amounted to $2.6 billion. The graph below shows that combined purchases of operating and capital purchased goods and services amounted to $952 million, or 37% of total expenditures. The next largest expenditure, at $941 million or 36% of total expenditures, was compensation, which includes salaries, wages and employee benefits. Of the remaining expenditures, 15% were for capital financing, including contributions to capital and debt financing, and 12% for external transfers, including social assistance, housing subsidies, child-care subsidies, cultural grants and payments to conservation authorities.
Total operating and capital expenditures, 2005 ($2.6 billion)

Performance measurement
Given the constraints on municipalities' ability to continue to meet service and infrastructure demands with existing funding mechanisms (the fiscal imbalance), it will soon become nearly impossible for cities to deliver all of the services they currently provide with only property tax and user fee increases to fund them. Council and City staff must have new tools to continuously improve services and to decide whether investments are yielding the anticipated results.
The new performance measurement and reporting framework the City adopted in early 2006 provides such a tool. It will lead to more and better information for managers and decision-makers, enhanced public accountability and, ultimately, improved performance. The performance measurement framework will allow the City to measure progress against plans, as well as to measure performance year over year, compare performance to service standards and measure performance against other Ontario municipalities.
These are the key components of the performance measurement and reporting framework.
The Ontario Municipal Benchmarking Initiative (OMBI)
Ottawa reports performance-related information to the provincial government through mandatory programs such as the Ontario Municipal Performance Measurement Program (MPMP) and the Financial Information Return (FIR). However, these measures represent only a small portion of City services. Ottawa also participates in the Ontario Municipal Benchmarking Initiative (OMBI), which draws upon base MPMP information and supplements it with additional data on municipal services. OMBI describes services from four perspectives:
- Community impact
- Service level
- Efficiency
- Customer service
OMBI currently involves 15 large Ontario municipalities that share information on approximately 600 performance measures across 33 program areas. By comparing performance data with other Ontario municipalities, OMBI allows Ottawa to benchmark its performance in various areas. This in turn helps the City identify and share best practice information, and apply what is learned to continuously improve service delivery and business processes.
When the City participated in OMBI for the first time in 2005, 22 program areas were reviewed and it reported on approximately half of the 500 performance measures. In 2006, the City is participating in all 33 program areas and will report on many of the performance measures by the end of 2006.
Finding valid (i.e., "apples-to-apples") comparators is a significant undertaking, given the differences in geography, demographics, services and service levels among Ontario municipalities. To that end, municipal program area managers are encouraged to participate in the OMBI subject matter expert working groups to ensure that the chosen performance indicators are meaningful, data definitions are appropriate, data analysis results are valid, and best practices are shared.
Annual Report
The City of Ottawa's annual report provides a performance overview for the previous year. The annual report sets out:
- The City's main goals
- The status of action items in the City Corporate Plan and departmental business plans
- High-level performance information for key programs and activities
The City's first annual report, in 2004, included audited financial statements and analysis as well as an overview of the City's key achievements. The 2005 annual report, issued in June 2006, provides enhanced information on the City's progress in achieving both the priorities set through the Ottawa 20/20 consultations and the desired outcomes identified in the 11 agendas in the City Corporate Plan.
Quarterly performance report to Council
Beginning in fall 2006, the City will provide Council with a quarterly report containing high-level metrics and information about the City's performance in major service areas. The goal of the report is to provide key measures for a cross-section of branches that deliver public services of high interest to Councillors. Over time, it is expected the report will change to incorporate Council's evolving areas of focus, and to include more performance measures. Ultimately, the quarterly performance report will provide information on 50 to 75 performance measures for up to 15 different branches.
The City is also developing a business intelligence and reporting application that builds on existing information systems such as SAP to produce real-time performance information. This application will allow managers to respond faster to emerging issues and quickly identify improvement areas.
Developing effective performance measurement systems takes time: time to design, time to implement and time to perfect. The City of Ottawa's performance measurement framework is in its early stages, and components are still being developed and perfected. Once complete, it will be a key tool that will support priority setting by Council, and will foster the City's continuous improvement culture by identifying where resources should be invested and operations enhanced.
Provincially mandated and cost-shared programs
The relationship between Ontario municipalities and the Province of Ontario has always involved programs that are primarily under the control of the provincial government, but are delivered, managed and partly funded from the municipal property tax base. While the Province establishes the service standards and policies for the vast majority of these programs, municipalities have limited discretion over the level of service provided, or the level of funding necessary to deliver these programs.
Under the 1998 Local Services Realignment process, the funding responsibilities for a number of new and existing program areas were either added or transferred to the municipalities or existing cost-sharing arrangements were changed.
Programs impacted by the 1998 process were:
- Employment and financial assistance
- Social housing
- Child-care services
- Long-term care
- Paramedic services
- Public health services
- Municipal Property Assessment Corporation (MPAC)
There has been a high growth rate of the City-funded portion of these programs since 1998.
Provincial cost-sharing arrangements
Because the Province sets the standards and the cost-sharing arrangements, Council has minimal control over these mandated programs. As a result, these cost-shared programs increase the amount of property taxes paid by residents living in Ottawa.
In 2001, provincially mandated programs represented $565 of the average property tax bill. Today, if all provincially mandated/cost-shared programs were funded at the provincial level, the average urban residential household in Ottawa would pay $670 less in property taxes per year.
Very few programs are 100% funded by the Province. The cost-sharing arrangements between Ottawa and the Province, by service, are listed in the following table. The table also shows which program areas have a funding gap (the difference between the provincially mandated revenue as stated in the cost-sharing agreements, and the anticipated amount the Province will provide the City). For 2006, the funding gap is projected to be $16 million.
As an example, costs for Paramedic Services were transferred to the City in 1998; the cost- sharing agreement was to be on a 50/50 basis between the Province and the City, but only to the level of service that the Province established. In 2005, Ottawa City Council proactively increased the service standard for paramedic response times to above the level of service set by the Province. As a result, the additional costs required to meet these higher service standards are not being subsidized at the 50% level. Fortunately, in its 2006 Budget, the Province announced that an additional $300 million would be given to municipalities in an effort to move towards 50/50 cost sharing for Paramedic Services over the next three years.14
The Province has also increased the funding for public health expenditures. Previously, the Province funded 50% of health expenditures. It moved to 65% in 2006, and will move to 75% in 2007. This additional funding has been used to reduce the net cost of providing health services, enhance existing services and meet increased service demands.
Provincially mandated services
| Branch | Services | Mandated cost-sharing arrangements | Prov. revenue as mandated ($ thousands) | 2006 Budget revenue ($ thousands) | Funding gap ($ thousands) |
|---|---|---|---|---|---|
| Paramedic services | Emergency medical patient care | 50% | 22,416 | 18,579 | 3,837 |
| Emergency medical dispatch | 100% | 5,567 | 5,567 | - | |
| Housing | Residential & support services | 80% | 19,734 | 18,876 | 858 |
| Housing programs administration | 0% | - | - | - | |
| Centralized waiting list (The Registry) | 0% | - | - | - | |
| Housing programs - rent supplement prog. | 15% | 2,719 | 2,719 | - | |
| Public housing | 0% | - | - | - | |
| Affordable housing development | 45% | 160 | 160 | - | |
| Director's office | 0% | - | - | - | |
| Child-care | Fee subsidy | 80% | 38,934 | 35,182 | 3,752 |
| Ontario Works | 80% | 3,222 | 3,222 | - | |
| Wage subsidy, special needs, Early Years | 80% | 14,091 | 14,091 | - | |
| Pay equity | 83% | 2,320 | 2,320 | - | |
| Best Start | 100% | 6,557 | 6,557 | - | |
| Administration | 50% | 1,544 | 1,544 | - | |
| Public health | Mandated Programs | 65% | 19,570 | 18,536 | 1,034 |
| Health protection (SARS, Smoke Free Ontario, Healthy Babies, etc.) | 100% | 8,172 | 8,172 | - | |
| West Nile | 65% | 543 | 543 | (0) | |
| Public health education & development | 65% | 742 | 543 | 199 | |
| Dental treatment | 0% | - | - | - | |
| Immunization program | 100% | 356 | 356 | - | |
| Employment & financial assistance | Ontario Works & financial assistance | 80% | 111,638 | 111,638 | - |
| Employment programs | 80% | 14,100 | 14,100 | - | |
| Essential health & social supports (EHSS) | 80% | 6,963 | 6,963 | - | |
| Home support programs | 80% | 1,818 | 1,568 | 250 | |
| Program delivery | 50% | 17,303 | 17,189 | 114 | |
| City-funded provincial programs | 80% | - | - | - | |
| Long-term care | Nursing & personal care | 100% | 24,777 | 17,692 | 7,085 |
| Program & support services | Funded on a per diem basis | 2,080 | 1,793 | 287 | |
| Food purchase | 100% | 1,386 | 1,386 | - | |
| Accommodation | 100% resident plus provincial minimum | 12,883 | 14,422 | (1,539) | |
| Outreach | 100% from the Province with user fee | 382 | 382 | - | |
| Total | 15,877 | ||||
Ontario funds social services from property taxation
Ontario is the only province in Canada to fund more than $3.5 billion of primarily social programs, like social services, social housing and public health, from the property tax bill each year. As seen in the graph below, municipal expenditures in Ontario, attributable to provincially mandated programs (after deducting conditional grants), are significantly higher than in any other province. As a result, municipal spending on programs funded from property taxation, such as social services, housing and public health, is $282 higher per capita in Ontario than in the rest of Canada.
The largest cost factor is social assistance, which requires Ontario municipalities to raise $173 more in taxation per capita than the rest of Canada.15 Other Canadian provinces simply do not fund these social programs through property taxes, resulting in much lower municipal costs and lower property taxes. Ontario municipalities have argued for many years that income redistribution programs, such as social assistance, should not be funded from property taxes - a regressive tax that is not reflective of the income level of a property owner. Rather, these programs should be linked to and funded more appropriately from provincial income taxes.
Municipal expenditures (after conditional grants) on provincially mandated services, per capita

Ottawa spending compared to other Ontario cities
Because Ontario is the only province to have a major portion of the costs for these items funded from the property tax bill, comparisons between property taxes in Ontario and other provinces are not valid.
The graph below compares Ottawa's 2005 gross costs (before grants or user fees) by household, for provincially mandated programs, with Toronto and the seven-city average.
Comparison of provincially mandated programs, per household

When compared to Toronto, Ottawa spends less per household on all programs except for the paramedic program. Because Ottawa City Council has proactively improved paramedic services, spending for this service, on a per household basis, is equivalent to Toronto.
Social assistance costs more on the Ottawa tax bill
Ottawa spends more than the seven-city average for all programs except long-term care and public health. This is to be expected since large urban areas are typically employment centres that generally tend to have more social services available, thereby attracting people looking for work and for assistance. The seven cities used in the comparison are smaller, suburban centres clustered around Toronto. As a result, most of the demand for social services is focused in Toronto itself.
While Toronto spends more, per household, on social assistance than Ottawa, the two cities are fairly comparable when looking at the net expenditure for the program.
Social assistance expenditure comparison

Toronto is able, through grants and subsidies from the Province and other municipalities, to reduce its gross program costs by 65%. Ottawa is only able to reduce the amount by 55%.
Toronto, unlike Ottawa, benefits from a provincially imposed Greater Toronto Area equalization formula, which pools social assistance and social housing costs, in the GTA area. The Province created this program for Toronto because its costs were higher than the average. This allows Toronto to receive funds from other GTA municipalities to compensate for its social assistance and social housing expenditures.
In 2005, this equalization formula saved Toronto taxpayers $189 million in taxation. Like Toronto, Ottawa's social assistance and social housing costs are also higher than the provincial average; however, Ottawa is not included in any type of pooling with surrounding municipalities. For illustrative purposes, if Ottawa were to be included in the GTA pooling, Ottawa residents would be relieved of $53 million in taxation per year.
The Province recently revised the Social Program Grant component in the Ontario Municipal Partnership Fund (OMPF). These grants are allocated to municipalities with high social costs relative to their residents' household incomes. By basing the grant on household income, the Province recognizes that income transfer programs, such as welfare, should be funded from income taxation and not property taxation. Ottawa will receive $6 million in OMPF grants in 2006 or approximately 3% of social program expenditures. Toronto, on the other hand, will receive $34.9 million, representing 6% of its social program costs. If Ottawa residents were to be treated the same as Toronto residents, the grant would be $12 million.
The provincial Municipal Property Assessment Corporation (MPAC) administers a uniform, Ontario-wide property assessment system for municipalities. Assessment values are used to calculate the amount of tax a property is charged.
MPAC costs have increased beyond inflation
Since 1998, Ontario cities have been required to pay a share of the cost of MPAC based on a combination of the number of properties and their assessed values. The cost of the Corporation is not within the control or influence of Council and is completely funded from taxes. Ottawa's share of the cost of the assessment service has increased by almost $2 million since amalgamation, representing an overall 25% increase, or 5% per year, well above the City's tax increase or the rate of inflation. For 2006, the cost of MPAC to the City is approaching $9.8 million.
Next steps: Provincial-Municipal Fiscal and Service Delivery Review
On August 14, 2006, Ontario announced its intent to strengthen its relationship with municipalities by launching a joint review aimed at improving the delivery and funding of municipal services for Ontario families. The Provincial-Municipal Fiscal and Service Delivery Review will be conducted by both levels of government over the next 18 months. A public report will be released in the spring of 2008.
Some of the areas that may be examined include:
- Delivery and funding of housing, health and social services
- Municipal financing tools, such as user fees and the use of municipal debt
- Infrastructure funding
- The Ontario Municipal Partnership Fund
Taxing powers, such as income tax and sales tax, will not be included in the review.
The Association of Municipalities of Ontario (AMO) has agreed to join in this initiative to allow the Province and the municipal sector to improve the delivery and funding of services for Ontarians. Together, the partners will examine how Ontario communities can prosper through initiatives such as better service delivery and improved infrastructure investment.
The joint review flows from the provincial government's plan to strengthen local government in Ontario. The plan includes the proposed Municipal Statute Law Amendment Act, 2006, which, if passed, would provide new powers and more flexibility to municipalities. Both partners have indicated their determination to investigate and deliver long-term sustainable options for the province and the municipal sector that are affordable to both levels of government.
14MFOA 2006 Provincial Budget Highlights.
15Kitchen, Harry M., "Ontario's Municipalities in the Fiscal Imbalance," Trent University. 2006.
Purchased services and materials
The City ensures the best price through competition
The City has more than 17,000 employees, covers a geographic area of 2,796 square kilometres, and owns hundreds of buildings ranging in age from one to a hundred years. Therefore, there are very few types of goods and services that are not needed by the City of Ottawa. To support its varied needs, the City routinely purchases:
- Construction services related to all types of civil infrastructure, roads, sewers, and bridges, and construction related to City-owned facilities.
- Fleet services, including all classes and types of vehicles, replacement parts, snow removal services, sewer maintenance, roadway sweeping, grass cutting and garbage removal services.
- Goods, including computer hardware and software, copiers and printers, electrical, plumbing and hardware equipment, office products and fine paper, telephone and radio systems, traffic control systems, medical and dental supplies, uniforms, parks and recreational equipment, trees, sod, road salt, water treatment chemicals, etc.
- Consulting services, including expertise in fields of engineering, architecture, planning and environmental studies, and legal services.
The City has a comprehensive purchasing by-law in place that requires services and goods to be purchased through a competitive process
The City has a comprehensive purchasing by-law in place that requires services and goods to be purchased through a competitive process. In 2005, the City issued nearly 700 formal bid solicitations for goods or services, each exceeding $100,000 in value, with a total contract value of $1.021 billion. Of these, 98% were awarded either to the lowest bidder or to the proposal that represented best value. The 2% that did not go through the competitive process were primarily for non-competitive services, such as local utility-type monopolies.
The City is able to leverage its position as a major consumer of goods and services to obtain best value. Some of its procurement strategies include:
- Two- or three-year contract terms that challenge bidders to provide the most competitive long-range business plan, in return for the economic benefits of a substantial contractual commitment with the City, allowing employment and supply chain decisions to be maximized.
- Extension options to continue purchasing a known, satisfactory service, often with a minimal cost increase.
- Incorporation of Ontario Ministry of Transportation formulas that allow fuel price escalation during the life of the contract. For example, this means that the Greater Ottawa Trucking Association and others who provide snow removal and garbage collection are able to submit accurate bids that are not inflated to reflect possible fuel price increases.
- Forward contracting for commodities subject to significant price volatility, such as diesel fuel. Locking in diesel fuel prices in July 2005 avoided over $1.5 million in price increases since then.
- Buying natural gas through the Ottawa Carleton Energy Purchasing Group (OCEPG), comprising 17 local organizations associated with the Municipal, Academic, School Board, Hospital (MASH) sector. The City has saved 7.3%, or $360,000 per year, thanks to this arrangement.
The City also minimizes the amount of stock held in inventory, using a just-in-time purchasing approach that sets minimum stock levels based on projected workload or demand. The City's inventories were valued at $23.4 million at the end of 2005. Approximately $86 million in materials and goods flow through the City's warehouse/stores each year.
The City also minimizes consumption of goods through such policies as "no idling" to reduce fuel consumption. Salt usage guidelines minimize the amount of road salt applied, and temperatures in City buildings are set higher in summer and lower in winter than in past years. All of these efforts promote responsible management of service costs.